Security Baseline on Azure hands-on lab step-by-step
Overview
Contoso is a multinational corporation, headquartered in the United States that provides insurance solutions worldwide. Its products include accident and health insurance, life insurance, travel, home, and auto coverage. Contoso manages data collection services by sending mobile agents directly to the insured to gather information as part of the data collection process for claims from an insured individual. These mobile agents are based all over the world and are residents of the region in which they work. Mobile agents are managed remotely, and each regional corporate office has a support staff responsible for scheduling their time based on requests that arrive to the system.
They are migrating many of their applications via Lift and Shift to Azure and would like to ensure that they can implement the same type of security controls and mechanisms they currently have. They would like to be able to demonstrate their ability to meet compliance guidelines required in the various countries/regions they do business. They have already migrated a web application and database server to their Azure instance and would like to enable various logging and security best practices for administrator logins, SQL Databases, and virtual network design.
Solution architecture
Contoso administrators recently learned about the Azure Security Center and have decided to implement many of its features to secure their cloud-based Azure infrastructure (IaaS) and applications (PaaS). Specifically, they want to ensure that any internet exposed resources have been property secured and any non-required internet access disabled. They also decided that implementing a “jump machine” for admins with Application Security was also important as they have had instances of admins installing non-approved software on their machines and then accessing cloud resources. Additionally, they want the ability to be alerted when TCP/IP Port Scans are detected, and fire alerts based on those attacks.
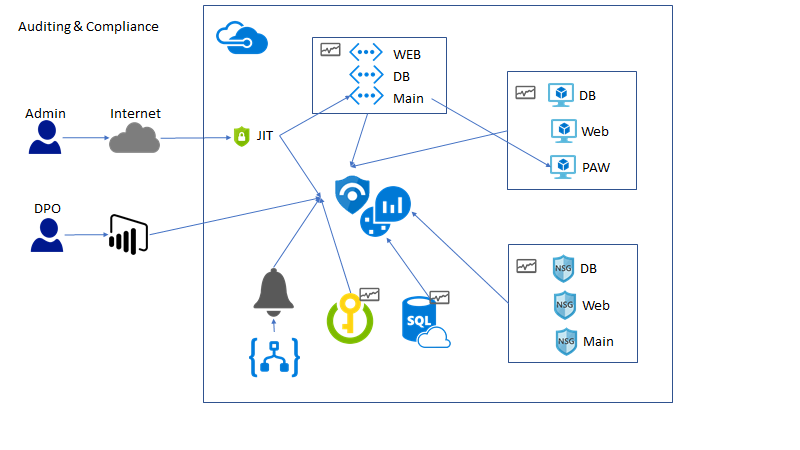
The solution begins by creating a jump machine. This jump machine is used to access the virtual machines and other resources in the resource group. All other access is disabled via multiple virtual networks. More than one virtual network is required as having a single virtual network would cause all resource to be accessible based on the default currently un-customizable security group rules. Resources are organized into these virtual networks. Azure Center Security is utilized to do Just-In-Time access to the jump machine. This ensures that all access is audited to the jump machine and that only authorized IP-addressed are allowed access, this prevents random attacks on the virtual machines from bad internet actors. Additionally, applications are not allowed to be installed on the jump machine to ensure that malware never becomes an issue. Each of the virtual network and corresponding network security groups have logging enabled to record deny events to Azure Logging. These events are then monitored by a custom alert rule in Azure Sentinel to fire custom alerts. Once the solution is in place, the Compliance Manager tool is utilized to ensure that all GDPR based technical and business controls are implemented and maintained to ensure GDPR compliance.
Requirements
- Microsoft Azure subscription must be pay-as-you-go or MSDN.
- Trial subscriptions will not work.
- A machine with the following software installed:
- Visual Studio 2019
- SQL Management Studio
- Power BI Desktop
Exercise 1: Implementing Just-in-Time (JIT) access
Duration: 15 minutes
In this exercise, attendees will secure a Privileged Access Workstation (PAW) workstation using the Azure Security Center Just-in-Time Access feature.
Task 1: Setup virtual machine with JIT
In a browser, navigate to your Azure portal (https://portal.azure.com).
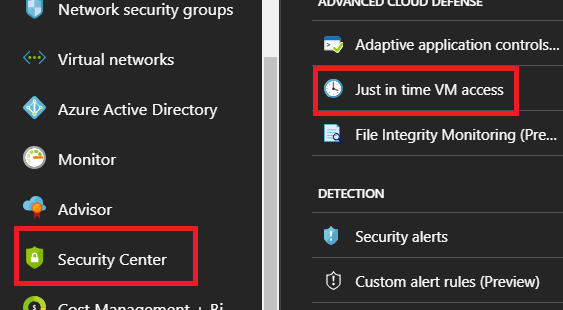
Select Security Center, then under ADVANCED CLOUD DEFENSE select Just in time VM access.
- Note: Your subscription may not be set up with the Standard tier; if that is the case then do the following:
- In the Security Center blade, select Pricing & settings.
- Select your subscription.
- Select Pricing Tier.
- Select Standard.
- Select Save.
- Navigate back to Security Center, select Just in time VM access.
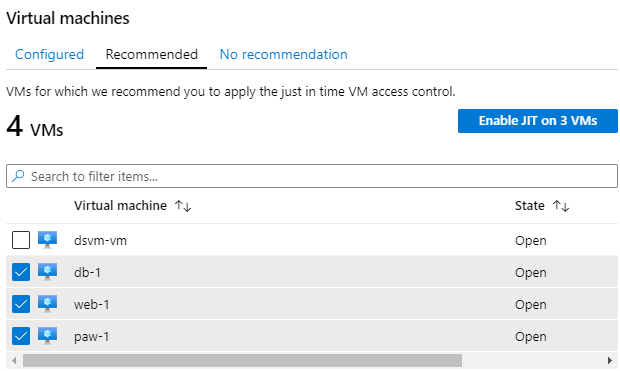
- Select the Configured tab, and verify the lab VMs (db-1, paw-1 and web-1) are displayed. If not, select the Recommended tab, and then check the checkbox to select the lab VMs (db-1, paw-1 and web-1), and then select the Enable JIT on 3 VMs link.
Note: It could take up to 10 minutes for new VMs to show up if you upgraded to standard tier security. Also note that it is possible new VMs display in the No recommendation tab until a backend process moves them to the Recommended tab. In you find the VMs do not show up after 10 minutes, you can manually enable JIT by choosing the Configuration tab in the VMs configuration blade and then Enable JIT Access.
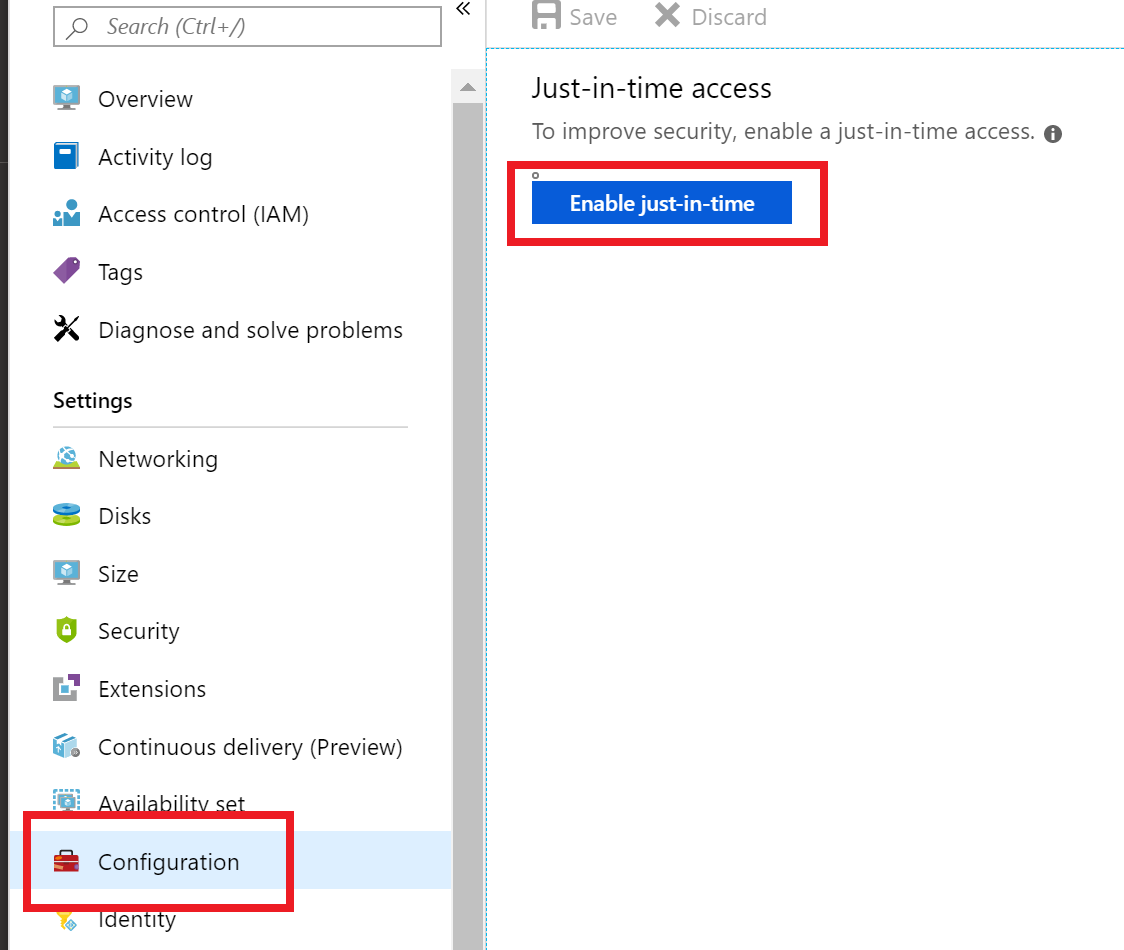
Configuration and Enable JIT Access is highlighted in the Azure portal.
In the configuration window that opens, review the settings, then select Save.
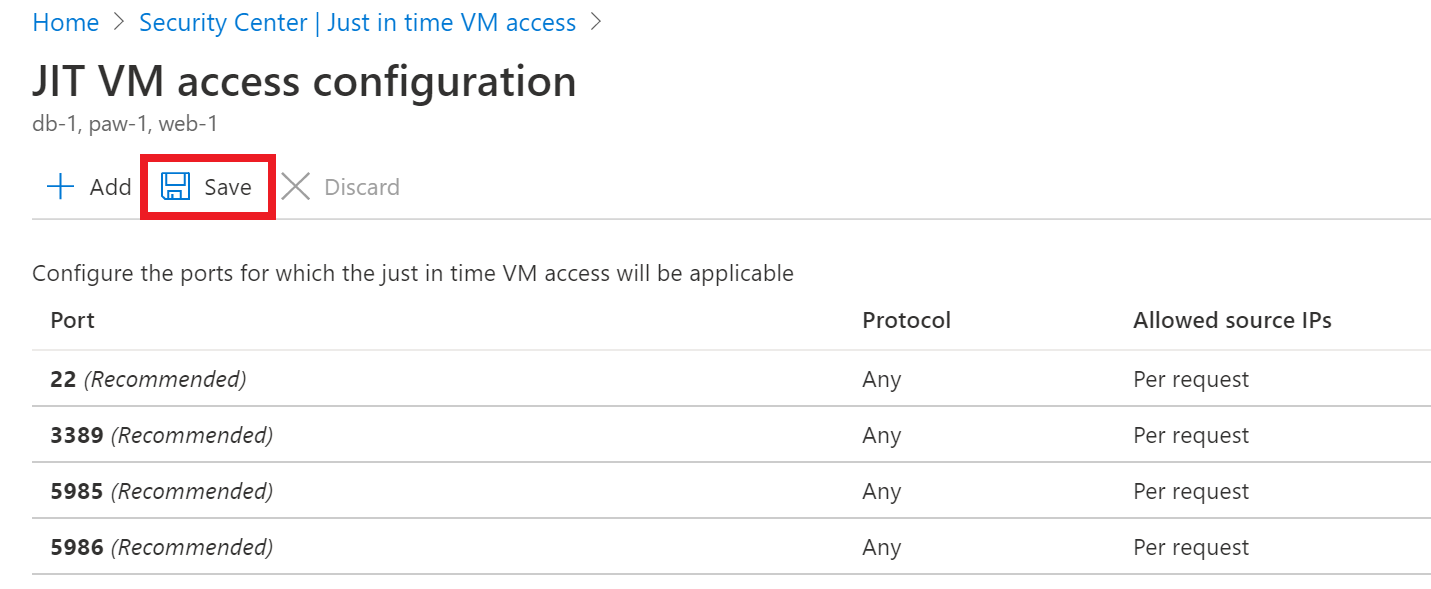
In the configuration window, port settings are listed, and Save is highlighted above them.
After a few minutes, you should see the virtual machines moved to the Configured tab.
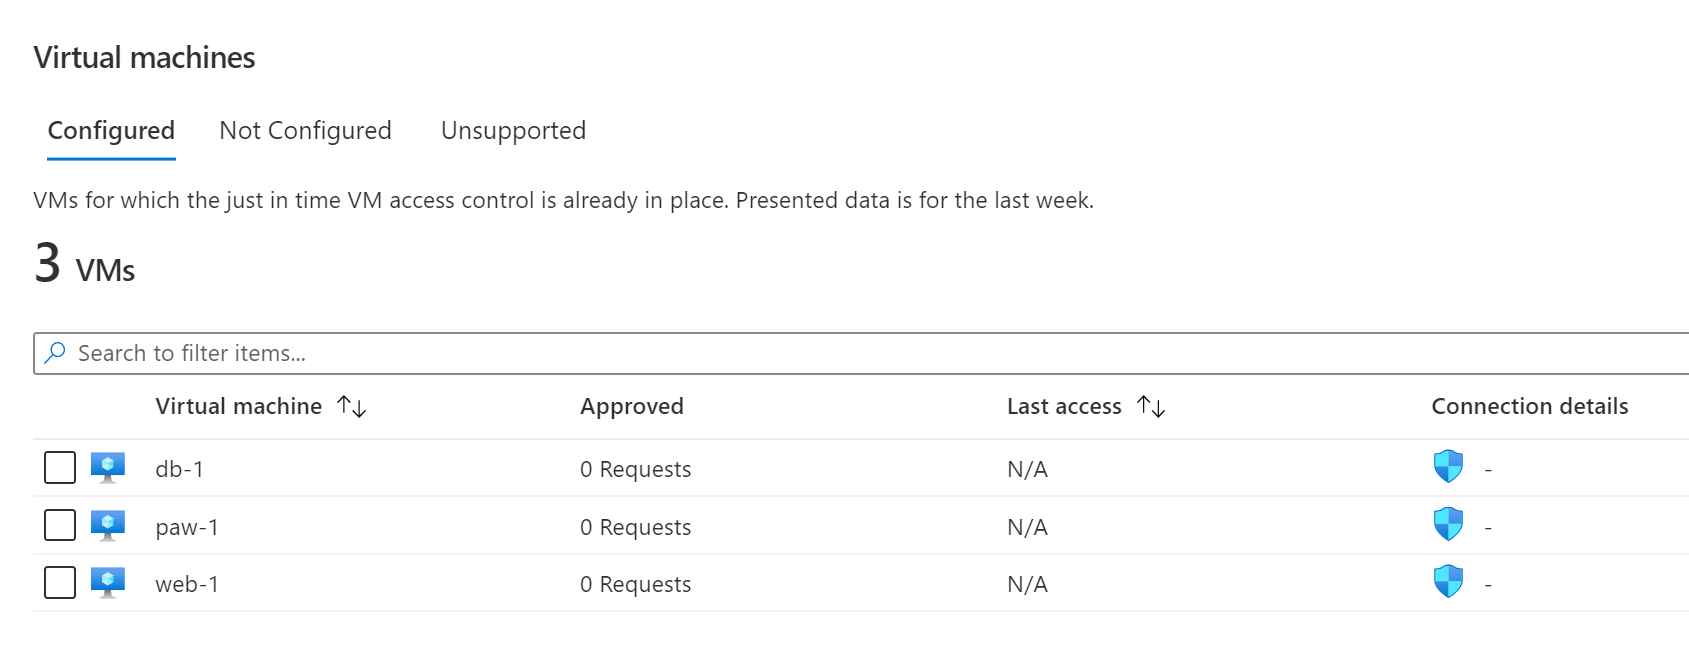 The virtual machines are now on the configured tab.
Task 2: Perform a JIT request
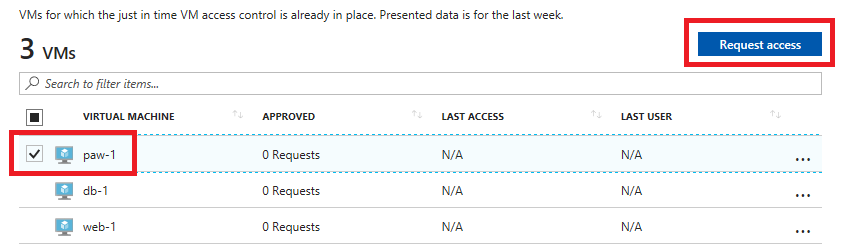
Select the paw-1 virtual machine, and then select Request access.
For each of the ports, select the On toggle button, notice how the default IP settings is My IP.
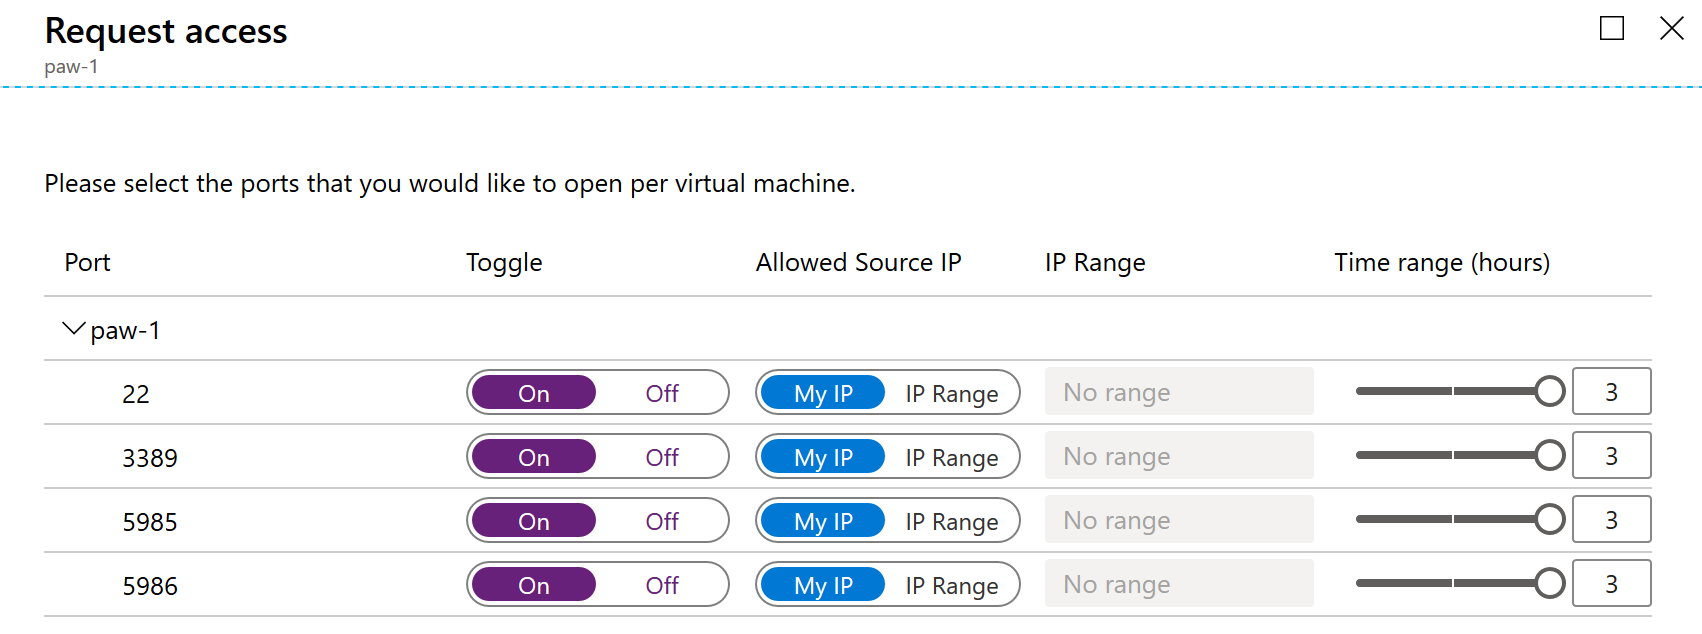
On is selected under the Toggle column for all four of the ports listed under paw-1.
At the bottom of the dialog, select Open ports. After a few moments, you should now see the APPROVED requests have been incremented and the Last Access is set to Active now..
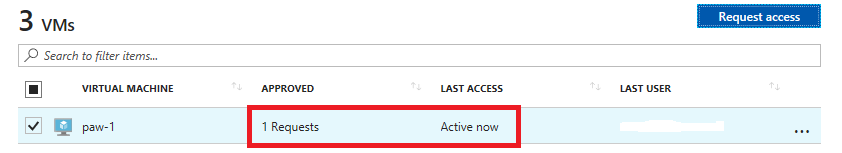
On the Virtual machines screen, the paw-1 virtual machine displays 1 Request as approved, and the last access column shows Active now.Note If you did not wait for your VMs and virtual networks to be fully provisioned via the ARM template, you may get an error.
Select the ellipses, then select Activity Log, you will be able to see a history of who requests access to the virtual machines.
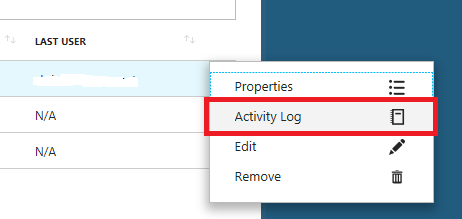 Activity Log is highlighted in the shortcut menu for the last user.Note: These entries will persist after you have deleted the VMs. You will need to manually remove them after VM deletion.
In the Azure Portal main menu, select All Services, then type Network, then select Network security groups.
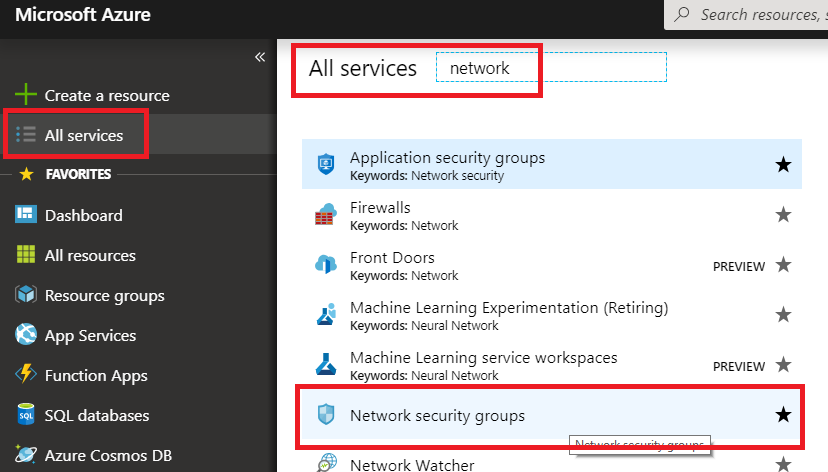
All services is highlighted in the left menu of the Azure portal, and the Network security groups is highlighted in the filtered list to the right.
In the filter textbox, type paw-1-nsg, then select the paw-1-nsg network security group.
Select Inbound security rules. You should now see inbound security rules set up by JIT Access.
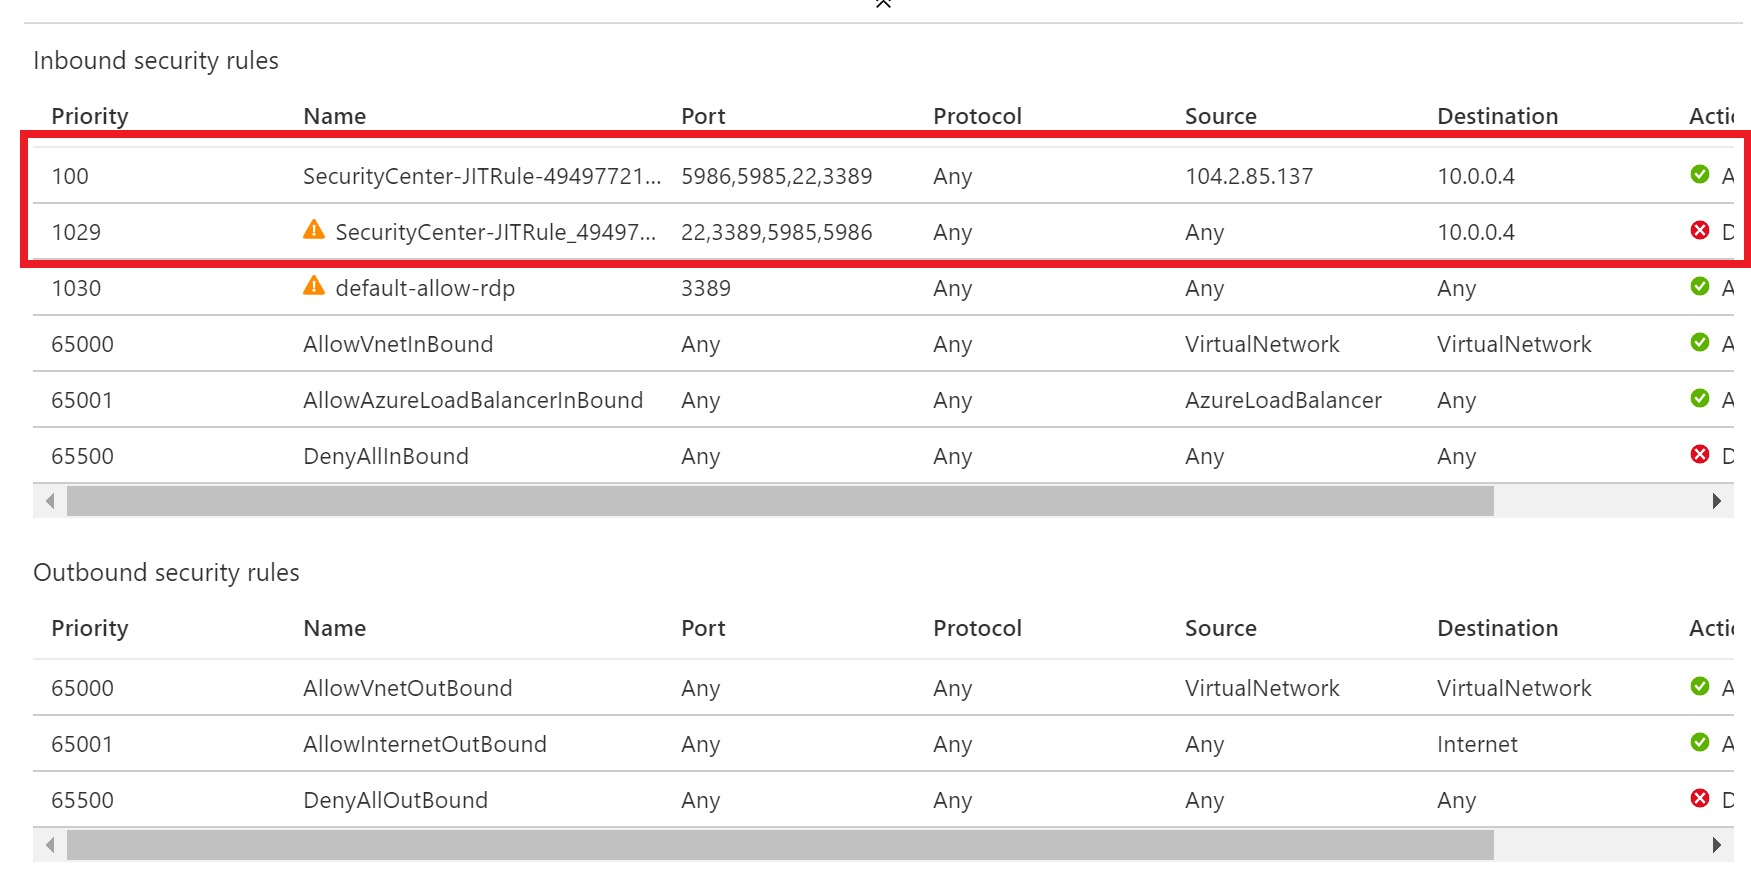
The first four listed items are highlighted under Inbound security rules.
Exercise 2: Securing the Web Application and database
Duration: 45 minutes
In this exercise, attendees will utilize Azure SQL features to data mask database data and utilize Azure Key Vault to encrypt sensitive columns for users and applications that query the database.
Task 1: Setup the database
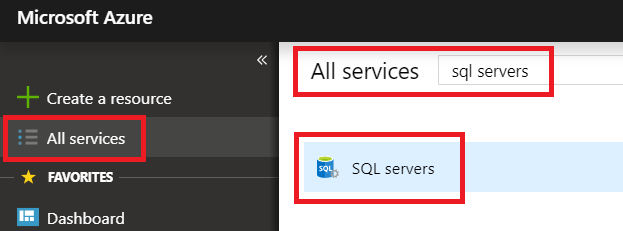
- Switch to your Azure portal, select All Services then search for SQL Servers. Select SQL Servers.
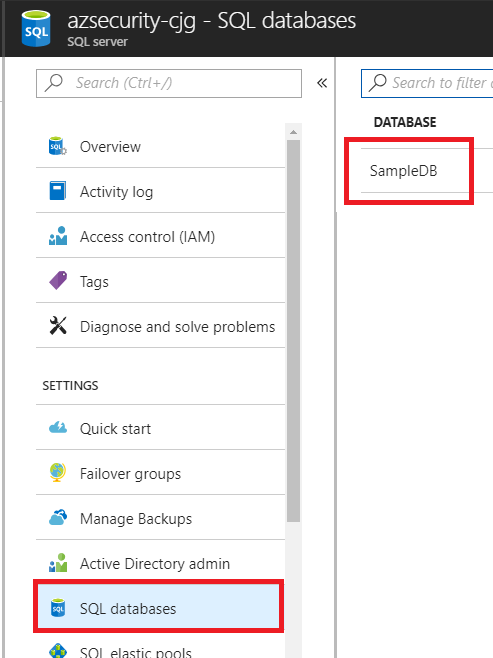
2. Select the Azure SQL database server you created using the Azure Manager template (Ex: AzureSecurity-INIT).
3. Select SQL databases under the Settings section, then select the SampleDB database.
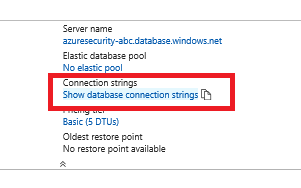
4. In the summary section, select the Show database connection strings.
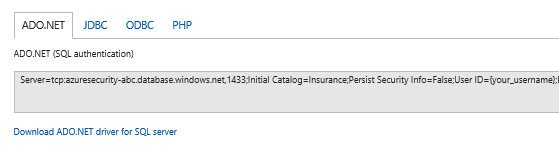
5. Take note of the connection string for later in this lab, specifically the Server parameter:
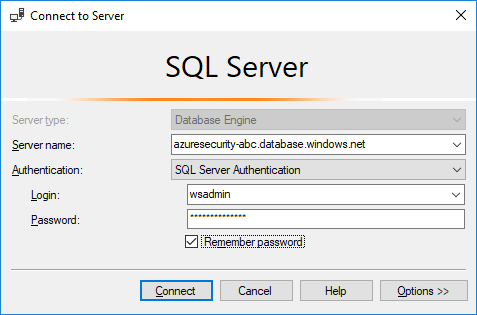
6. In the Lab VM, open SQL Server Management Studio.
7. Enter the database server name from above.
8. Enter the username and password used from the Azure Template deployment (wsadmin – p@ssword1rocks).
Note: If you changed the username and password in the ARM template deployment, use those values instead.
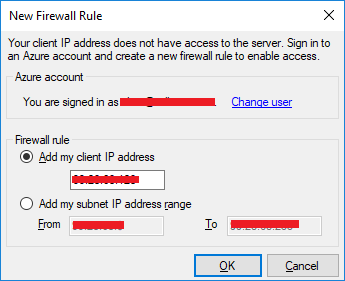
9. Depending on how you connected to the Azure SQL environment (inside or outside your VNet), you may be prompted to add a firewall rule. If this occurs, perform the following actions:
- Select Connect, in the New Firewall Rule dialog, select Sign In.
- Sign in with your resource group owner credentials.
- In the dialog, select OK, notice how your incoming public IP address will be added for connection.
10. Right-click Databases, and select Import Data-tier Application.
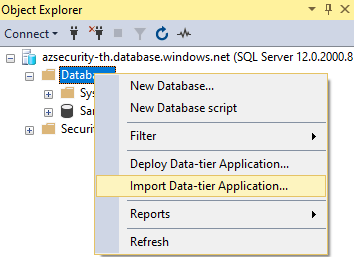
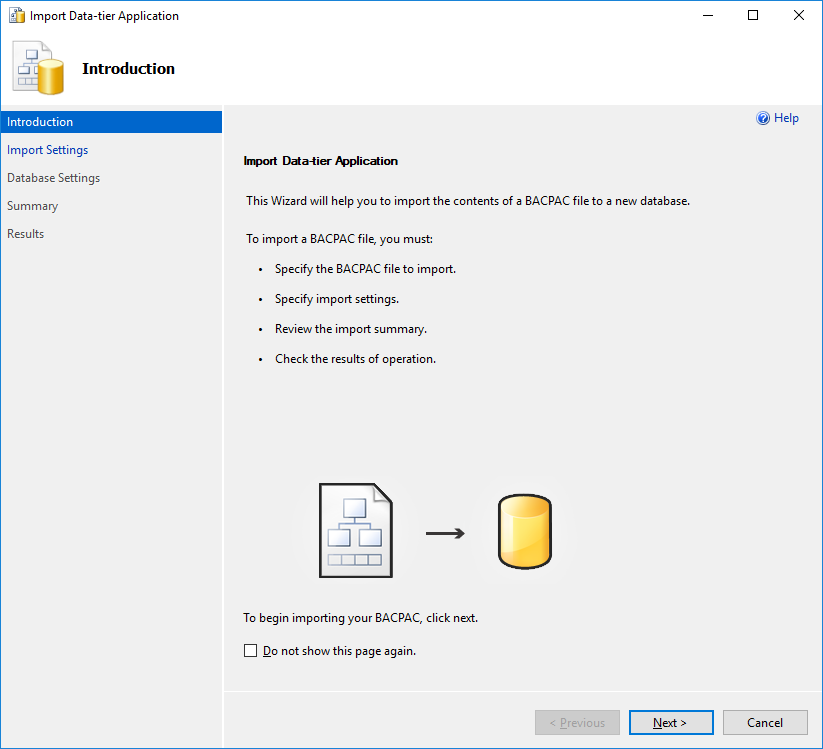
11. In the Introduction dialog, select Next.
12. Select Browse, navigate to the extracted /Hands-on- lab/Database directory, and select the Insurance.bacpac file.
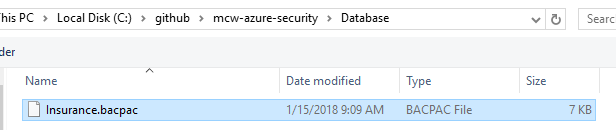
13. Select Open.
14. On the Import Settings dialog, select Next.
15. On the Database Settings dialog, select Next.
Note: If you get an error, close and re-open SQL Management Studio try the import again. If that does not work, you may need to download the latest SQL Management Studio from here. In some instances, the latest version may not work, version 17.3 is known to deploy the package properly. You should also be aware that bacpac files exported from some SQL Server instances cannot be deployed to Azure SQL Servers. We have also included a .bak file of the Insurance database that you can use to restore from.
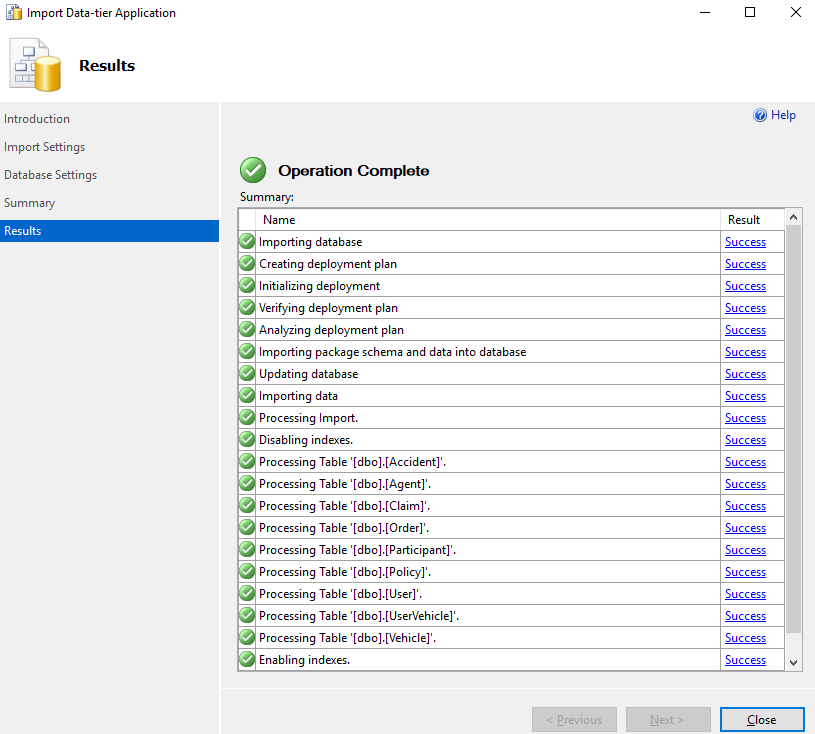
16. Select Finish and the database will deploy to Azure. It may take a few minutes.
17. Once completed, select Close.
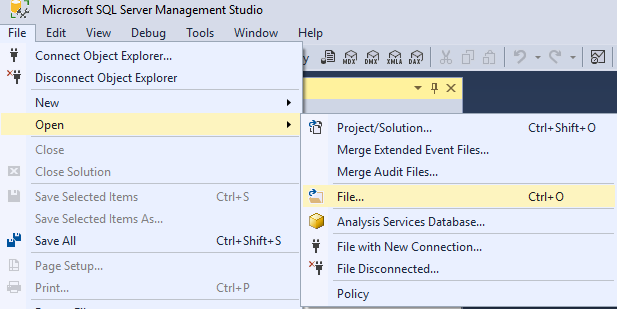
18. In SQL Management Studio, select File->Open->File.
19. Browse to the extracted GitHub folder, select the \Hands-on lab\Database\00_CreateLogin.sql file.
20. Ensure that the master database is selected.
21. Run the script to create a login called agent.
22. Browse to the extracted folder, select the \Hands-on lab\Database\01_CreateUser.sql file.
23. Ensure that the Insurance database is selected.
24. Run the script to create a non-admin user called agent.
Task 2: Test the web application solution
- In the extracted directory, double-click the \Hands-on lab\WebApp\InsuranceAPI\InsuranceAPI.sln solution file, and Visual Studio will open.
Note: If prompted, login using your Azure / MSDN account.
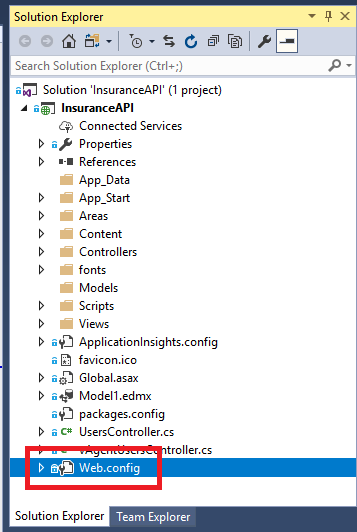
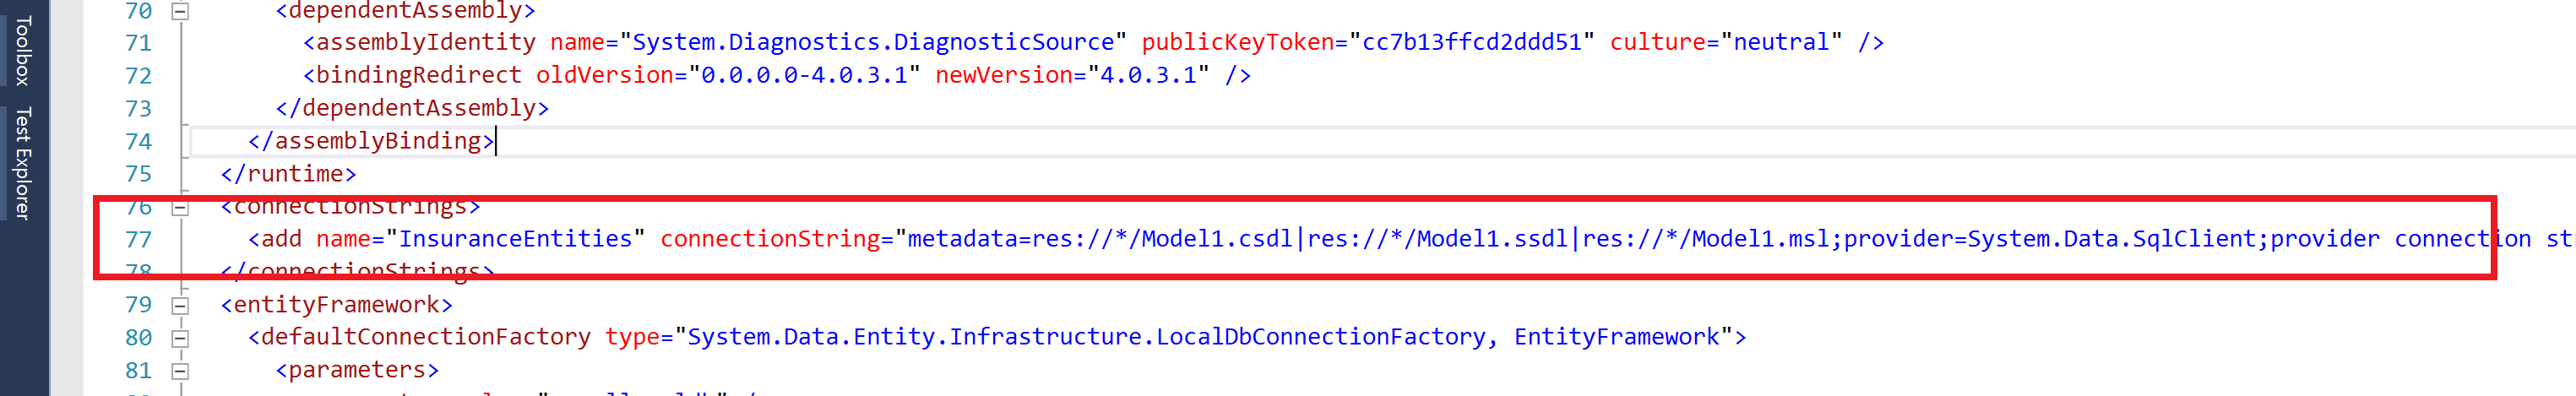
2. In the Solution Explorer, navigate to and double-click the Web.config file to open it.
3. Update the web.config (line 77) to point to the Insurance database created in Task 2. You should only need to update the server name to point to your Azure SQL Server.
4. Press F5 to run the InsuranceAPI solution.
Note: If you get an CSC error, right-click the project, select Clean. Next, right-click the project and select Rebuild.
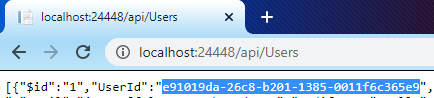
5. Test the API for a response by browsing to http://localhost:24448/api/Users. Your port number may be different from 24448. You should see several records returned to the browser. Copy a UserId value for the next instruction.
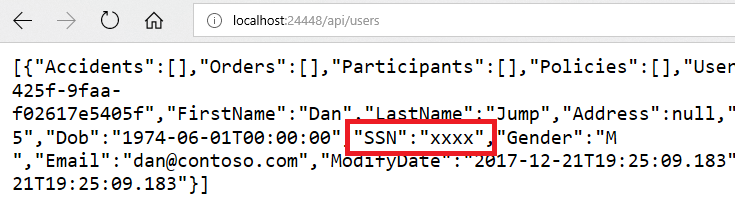
6. In the browser window that opens, browse to http://localhost:24448/api/Users/e91019da-26c8-b201-1385-0011f6c365e9 you should see a json response that shows an unmasked SSN column.
Note: Depending on your browser, you may need to download to view the json response.
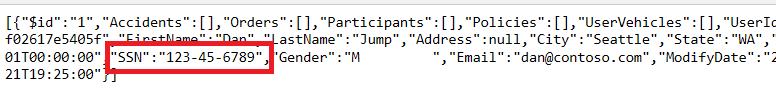 The json response is displayed in a browser window.
Task 3: Utilize data masking
- Switch to the Azure Portal.
2. Select SQL databases.
3. Select the Insurance database.
4. Under Security, select Dynamic Data Masking, then select +Add Mask.
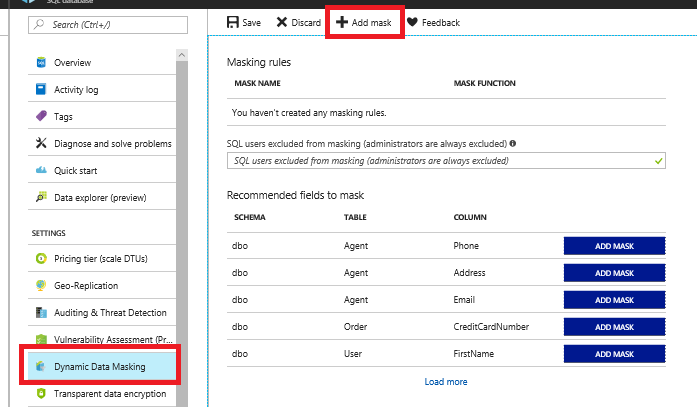
5. Select the User table.
6. Select the SSN column.
7. Select Add.
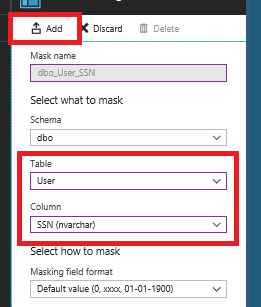
8. Select Save, then select OK.
9. Switch back to your InsuranceAPI solution, press F5 to refresh the page. You should see the SSN column is now masked with xxxx.
10. Close Visual Studio.
Task 4: Utilize column encryption with Azure Key Vault
Switch to SQL Management Studio.
Select File->Open->File, then open the 02_PermissionSetup.sql file.
Switch to the Insurance database, and execute the SQL statement.
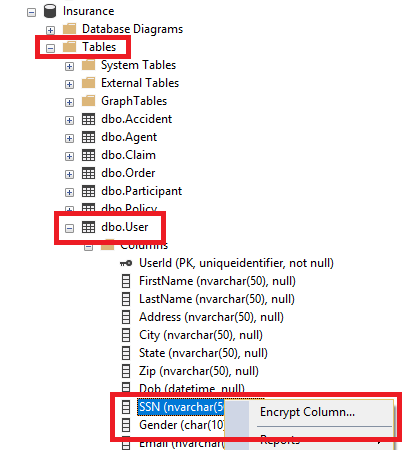
In the Object Explorer, expand the Insurance node.
Expand the Tables node.
Expand the User table node.
Expand the Columns node.
Right-click the SSN column, and select Encrypt Column.
Notice that the State of the column is such that you cannot add encryption (data masking):
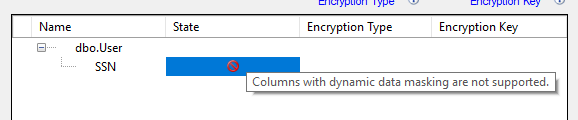
9. Select Cancel.
10. Switch back to the Azure Portal, and select the User_SSN data masking.
11. Select Delete.
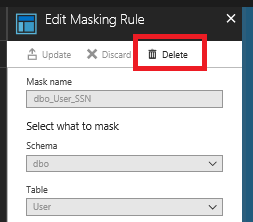
12. Select Save.
13. Switch back to SQL Management Studio.
14. Right-click the SSN column, and select Encrypt Column.
15. Check the checkbox next to the SSN column.
16. For the Encryption Type, and select Deterministic.
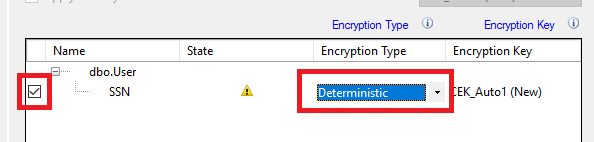
Deterministic encryption always generates the same encrypted value for any given plain text value. Using deterministic encryption allows point lookups, equality joins, grouping and indexing on encrypted columns. However, it may also allow unauthorized users to guess information about encrypted values by examining patterns in the encrypted column, especially if there’s a small set of possible encrypted values, such as True/False, or North/South/East/West region. Deterministic encryption must use a column collation with a binary2 sort order for character columns.
Randomized encryption uses a method that encrypts data in a less predictable manner. Randomized encryption is more secure, but prevents searching, grouping, indexing, and joining on encrypted columns.
17. Select Next.
18. For the encryption select Azure Key Vault in the dialog.
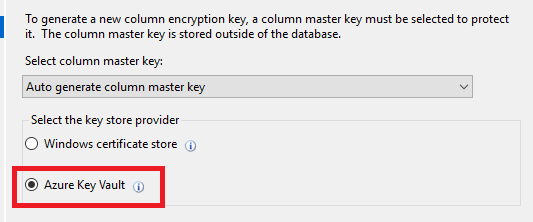
19. Select Sign In.
20. Sign in with your Azure Portal credentials.
21. Select your Azure Key Vault.
22. Select Next.
23. On the Run Settings, select Next.
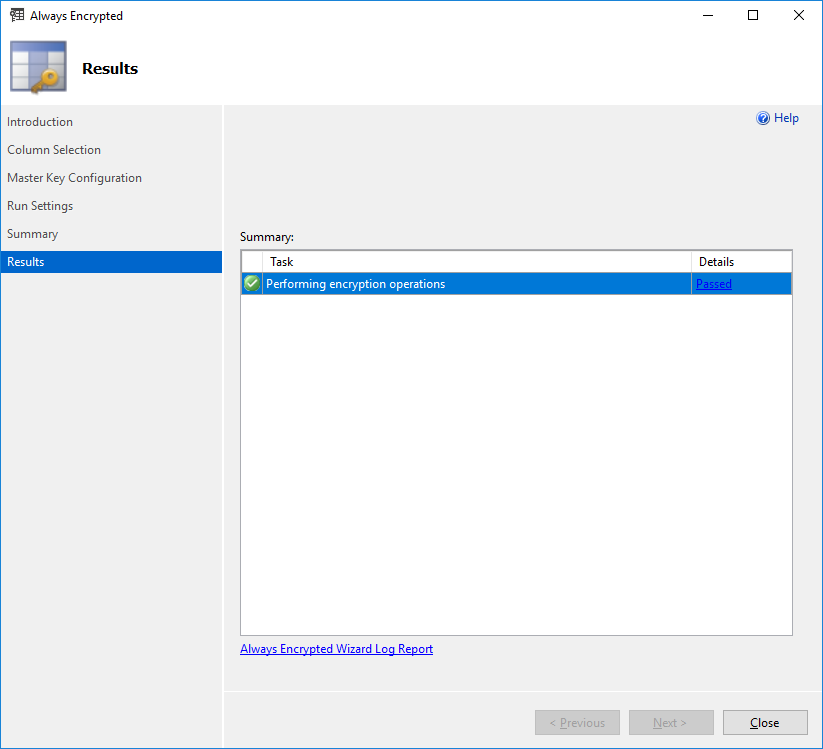
24. Select Finish, and the configured will start.
Note: You may receive a “Wrap Key” error. If so, ensure that your account has been assigned the wrapKey permission in the Azure Key Vault.
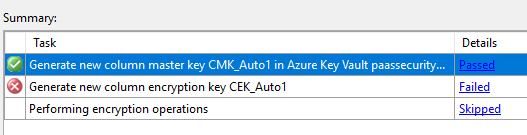 Generate new column master key CMK_Auto1 in Azure Key Vault is highlighted with a green check mark at the top of the Task Summary list.
- Select Key vault.
- Select your key vault.
- Select Access policies.
- Select Add New.
- For the principal, select your account.
- Select Key permissions, and choose Select all.
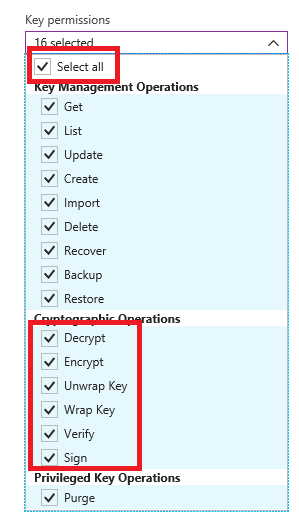
- Select all is selected and highlighted under Key permissions, and below that, Decrypt, Encrypt, Unwrap Key, Wrap Key, Verify, and Sign are selected and highlighted under Cryptographic Operations amid the other selected options.
- Select Secret permissions, and choose Select all.
- Select Certificate permissions, and choose Select all.
- Select OK.
- Select Save.
- Retry the operation.
Note: If you are still getting errors (such as Access Denied), ensure that you have selected the correct subscription and Key Vault.
25. Select Close.
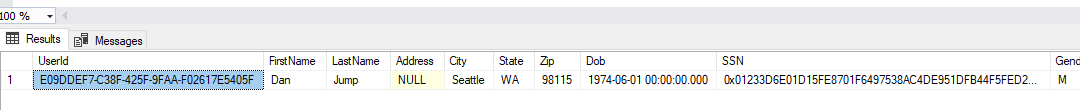
26. Right-click the User table, and choose Select top 1000 rows.
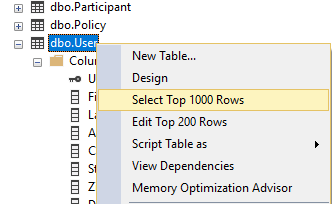
You will notice the SSN column is encrypted based on the new Azure Key Vault key.
27. Switch to the Azure Portal.
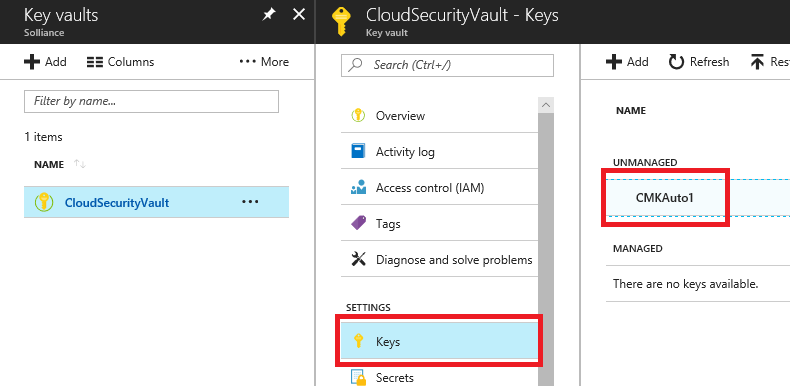
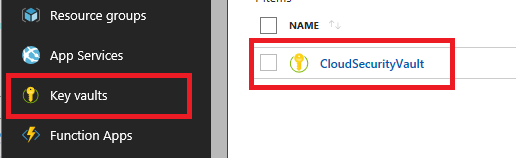
28. Select Key Vaults.
29. Select your Azure Key Vault, and then select Keys. You should see the key created from the SQL Management Studio displayed:
Exercise 3: Migrating to Azure Key Vault
Duration: 30 minutes
In this exercise, attendees will learn how to migrate web application to utilize Azure Key Vault rather than storing valuable credentials (such as connection strings) in application configuration files.
Task 1: Create an Azure Key Vault secret
Switch to your Azure Portal.
Select Key Vaults, then select your Azure Key Vault.
Select Secrets, then select +Generate/Import.
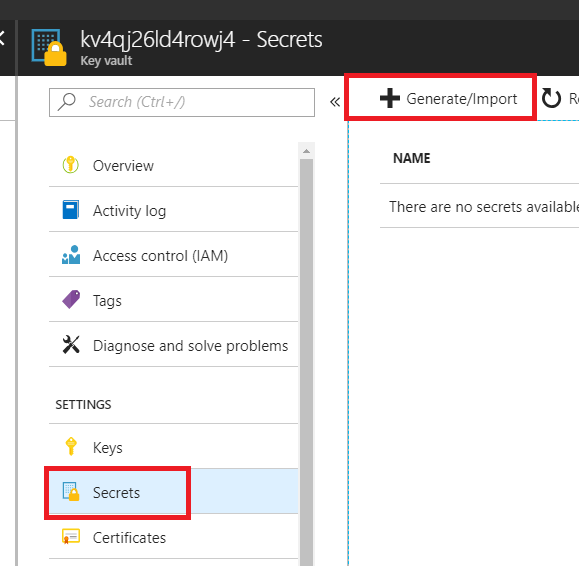 Secrets is highlighted on the left side of the Azure portal, and Generate/Import is highlighted on the right.
For the Upload Options, select Manual.
For the Name, enter InsuranceAPI.
For the Value, copy the connection string information from the InsuranceAPI solution Web.config file in Exercise 2.
Select Create.
Select Secrets.
Select InsuranceAPI.
Select the current version.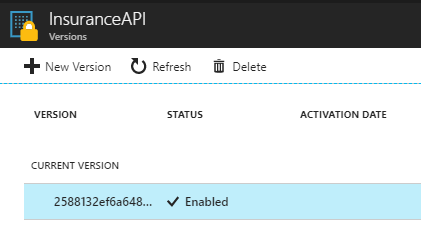 The current version is selected with a status of Enabled under InsuranceAPI Versions.
Copy and record the secret identifier URL for later use: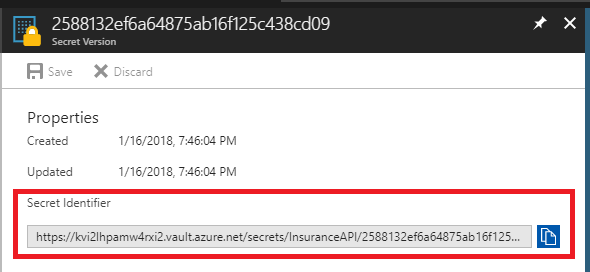 The Secret Identifier URL is highlighted under Properties.
Task 2: Create an Azure Active Directory application
- In the Azure Portal, select Azure Active Directory, then select App registrations.
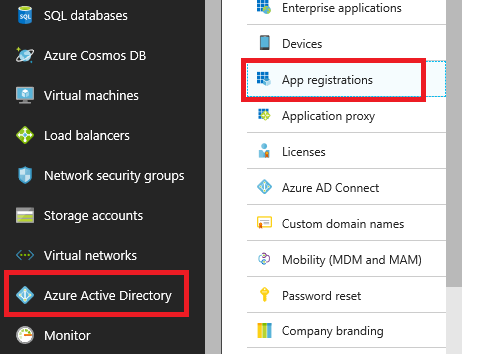 Azure Active Directory is highlighted on the left side of the Azure portal, and App registrations is highlighted on the right.
 - Select +New application registration.
- For the user-facing display name, type AzureKeyVaultTest.
- For the supported accounts, select Accounts in this organization directory only…
- For the Redirect URL, type http://localhost:12345.
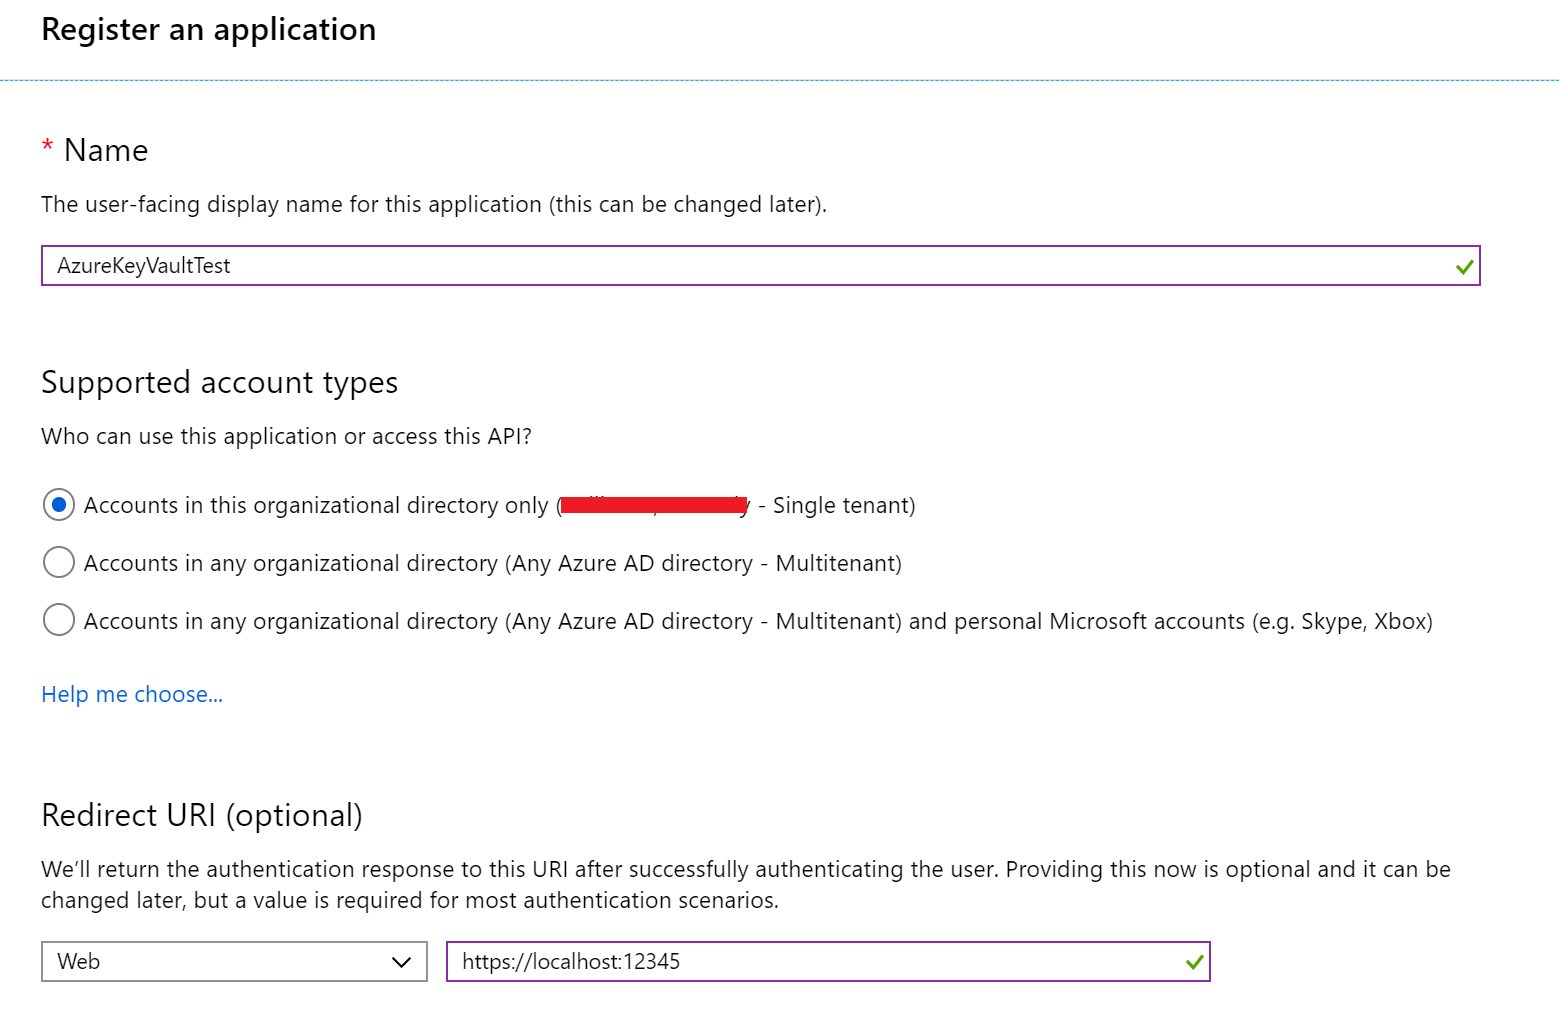 AzureKeyVaultTest is entered in the Name box, and http://localhost:12345 is entered in the Sign-on URL box under Create.
 - Select Register.
- Copy and record the Application ID for later use.
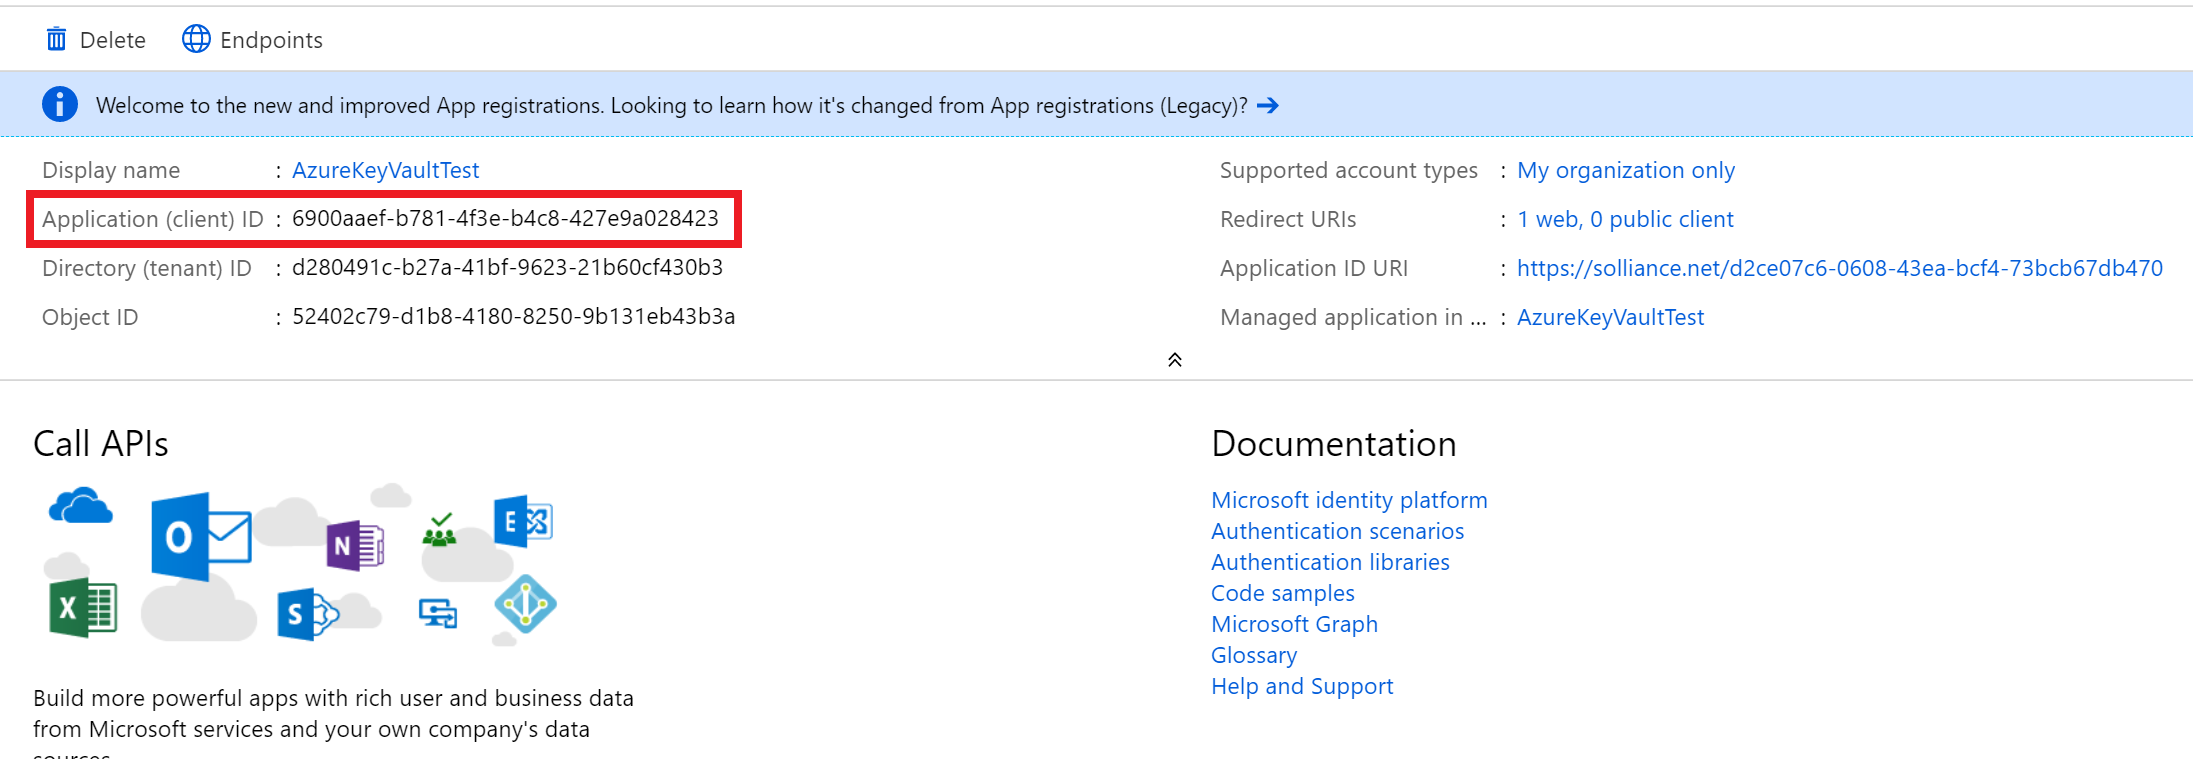 The Application ID and Object ID are highlighted under Essentials for the AzureKeyVaultTest application, and All settings is selected at the bottom.
 - In the left menu pane, under the Manage heading, select Certificates and secrets link.
- Under Client secrets, select New client secret.
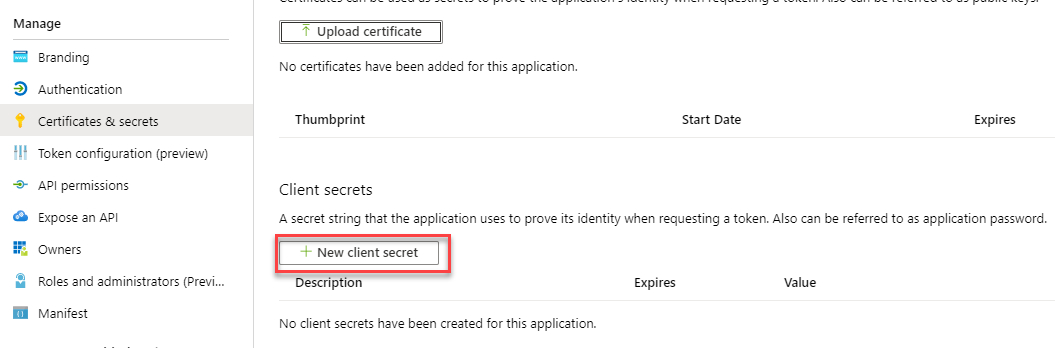 In the Certificates and secrets window, the New client secret button is selected.
 - For the description, enter InsuranceAPI.
- For the Expires, select In 1 year.
- Select Add.
- Copy and record the key value for later use.
Task 3: Assign Azure Active Directory application permissions
- Switch back to Azure Portal and select your Azure Key Vault.
- Under the Settings heading, select Access Policies.
- Select + Add Access Policy.
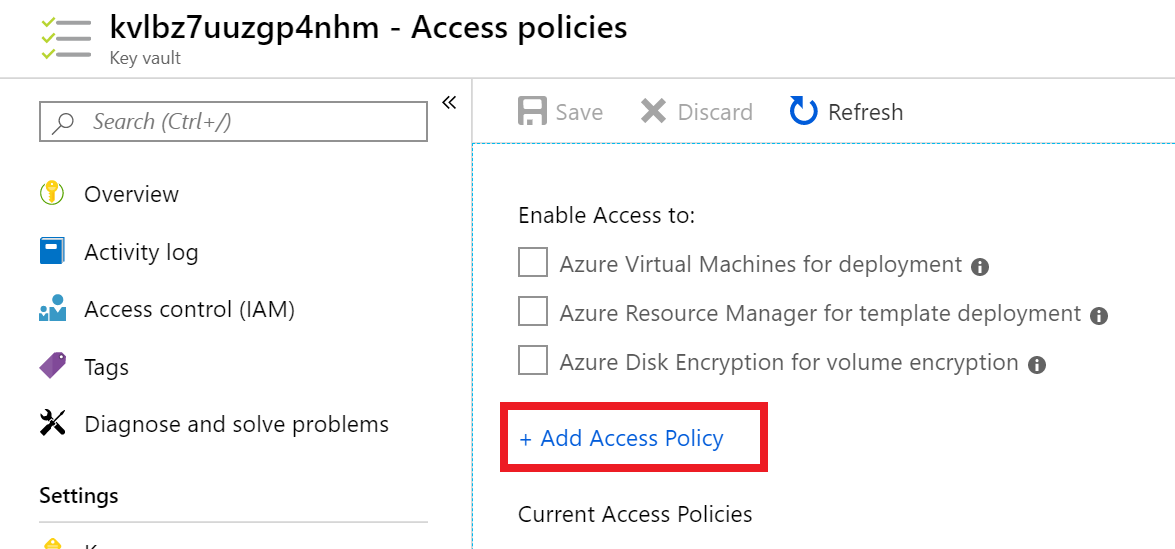 In the Access policies screen, the + Add Access Policy button is selected.
 - Choose Select principal field value. In the right-hand pane, type AzureKeyVaultTest. Select the item.
- Choose the Select button at the bottom.
- Select the Secret permissions drop-down, check the Get and List permissions.
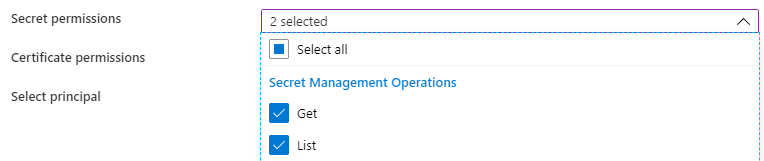 In the secret permissions drop down options, the Get and List operations are selected.Your selection summary should look like this.
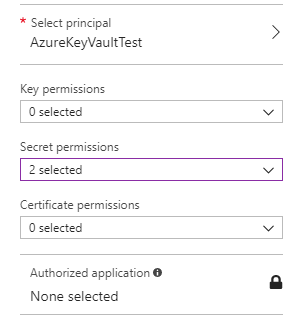 The AzureKeyVaultTest principal is selected and the secret permissions drop down list states there are two selected values.
 - Select Add button.
- Select Save button at the top.
Task 4: Install or verify NuGet Package
- Close the previous Visual Studio solution, then from the extracted GitHub directory, open the \Hands-on lab\WebApp\InsuranceAPI_KeyVault\InsuranceAPI.sln solution.Note: Be sure you re-open the correct solution.
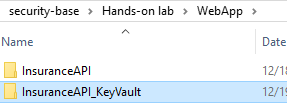 The screenshot displays the folder structure for both Visual Studio solutions.
 - Switch to Visual Studio.
- In the menu, select View->Other Windows->Package Manager Console.
- In the new window that opens, run the following commands:
Install-Package Microsoft.CodeDom.Providers.DotNetCompilerPlatformInstall-Package Microsoft.IdentityModel.Clients.ActiveDirectory -Version 2.16.204221202Install-Package Microsoft.Azure.KeyVaultNote: These already exist in the project but are provided as a reference. If you receive a codedom version error when you debug, run this command.Update-Package Microsoft.CodeDom.Providers.DotNetCompilerPlatform -r - From Solution Explorer, double-click the Web.config file to open it.Notice the appSettings section has some token values:
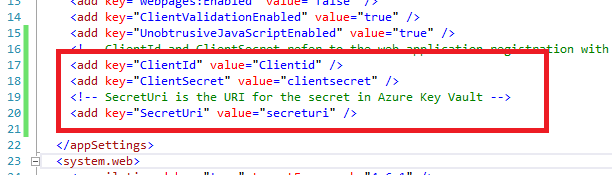 Some token values are highlighted in the appSettings section of the Web.config file.
 - Replace the ApplicationId (ClientId) and ClientSecret with the values from Task 2.
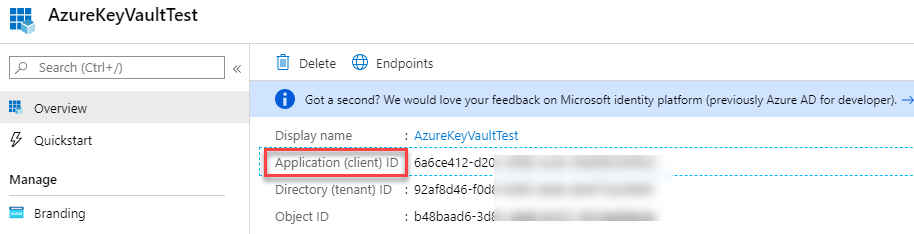 The pane is displaying the Application Registration information. ApplicationId is circled.
 - Replace the SecretUri with the Azure Key Vault secret key Uri from Task 1.
- Save the Web.config file in Visual Studio.Note: You can take this lab a step further and publish the Web App to an Azure App Service and enable System-assigned Managed Identities. This will allow you to completely remove any authentication from your configurations and utilize Key Vault references.
Task 5: Test the solution
- Open the Web.config, and comment out or delete the connectionString from the file at line 78.
- Open the Global.asax.cs file, and place a break point at line 28.Note: This code makes a call to get an accessToken as the application you set up above, then make a call to the Azure Key Vault using that accessToken.
- Press F5 to run the solution.You should see that you execute a call to Azure Key Vault and get back the secret (which in this case is the connection string to the Azure Database).
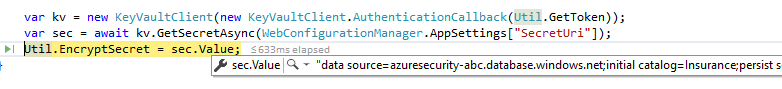 The connection string to the Azure Database is visible through the Visual Studio debugger.
 - Press F5 to continue the program.
- Navigate to http://localhost:portno/api/Users, you should get an error. Because you encrypted the column in the previous exercise, EntityFramework is not able to retrieve the value(s) using default settings. In order to do seamless decryption, you would need to:
- Run the \Hands-on lab\Database\02_PermissionSetup.sql script if you have not already done so.
- Add the AzureKeyVaultProvider for Entity Framework reference to the project.
- Register the provider code in order for .NET to handle the encrypted column.
- Add an access policy to the Azure Key Vault that gives key permissions (
decrypt,sign,get,unwrapkey,verify) to the Azure AD application. - Add the
Column Encryption Setting=Enabledto the connection string. - Detailed steps can be found in this blog post
- A third solution (\Hands-on lab\WebApp\InsuranceAPI_KeyVault_Encrypted\InsuranceAPI.sln) was added to the GitHub repo that has the necessary references and code added.
- Simply update the web.config file with your client id and secret after adding the required Key Vault permissions above.
- Update the Key Vault connection string to have the
Column Encryption Setting=Enabled. - Review the code added to the global.asax.cs file.
- Run the project and navigate to the above page.
Exercise 4: Securing the network
Duration: 45 minutes
In this exercise, attendees will utilize Network Security Groups to ensure that virtual machines are segregated from other Azure hosted services and then explore the usage of the Network Packet Capture feature of Azure to actively monitor traffic between networks.
Task 1: Test network security group rules #1
- In the Azure Portal, select Virtual Machines.
- Select paw-1, then select Connect.
- In the dialog, select Download RDP file Anyway. Open the downloaded RDP file and connect to the Virtual Machine.Note: Default username is wsadmin with p@ssword1rocks as password and you may need to request JIT Access if you have taken a break between exercises.
- In the paw-1 virtual machine, open Windows PowerShell ISE as administrator.
- Select the Windows icon.
- Right-click Windows PowerShell ISE, choose More, then select Run as Administrator.
- Copy and run the following command:
Set-ExecutionPolicy -ExecutionPolicy Unrestricted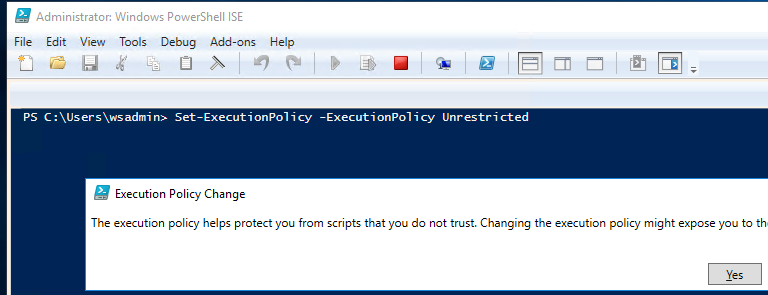 The PowerShell ISE window displays the execution policy change command.
 - In the dialog, select Yes.
- Select File->Open, browse to the extracted GitHub directory and open the \Hands-on lab\Scripts\PortScanner.ps1.Note: You would have downloaded the GitHub repo and extracted this in the setup steps. If you did not perform those steps, perform them now. You can also choose to copy the file from your desktop to the VM.
- Review the script. Notice that it does the following for various exercises:
- Installs Putty
- Installs NotePad++
- Adds hosts entries for DNS
- Executes port scans
- Executes brute force SSH attack
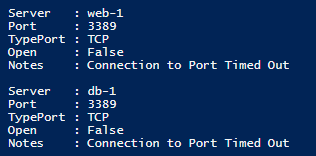
- Press F5 to run the script for exercise 4. You should see the following:Note: The ARM template deploys a Deny All rule. If you were to simply create a Network Security Group from the UI, you would not experience this behavior.
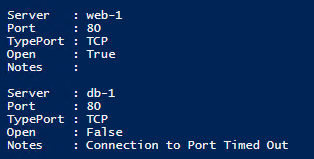
- Port scan for port 3389 (RDP) to db-1 and web-1 is unsuccessful from the paw-1 machine.
- The information above for port 3389 (RDP) is visible after running the script and pressing F5.
 The information above for port 3389 (RDP) is visible after running the script and pressing F5.
- Port scan for port 1433 (SQL) to db-1 and web-1 is unsuccessful from the paw-1 machine. db-1 is running SQL Server but traffic is blocked at NSG and via the Windows Firewall by default, however a script ran in the ARM template to open port 1433 on the db-1 server.
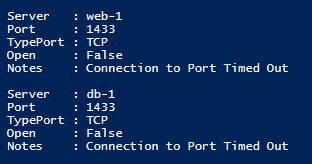 The information above for port 1433 (SQL) is visible after running the script and pressing F5.
- Port scan for port 80 (HTTP) to db-1 and web-1 is unsuccessful from the paw-1 machine, if traffic was allowed, it would always fail to db-1 because it is not running IIS or any other web server.
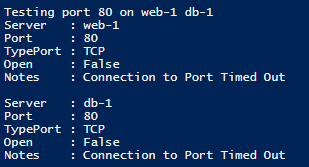 The information above for port 80 (HTTP) is visible after running the script and pressing F5.
Task 2: Configure network security groups
- Switch to the Azure Portal.
- Configure the database server to only allow SQL Connections from the web server:
- Select Network Security Groups.
- Select DbTrafficOnly.
- Select Inbound Security Rules.
- Select +Add.
- For the Source, select IP Addresses.
- For the Source IP address, enter 10.2.0.4.
- For the Destination, keep Any.
- For the Destination port range, enter 1433.
- For the Priority, enter 100.
- For the Name, enter Port_1433.
- Select Add.
- Select +Add.
- For the Source, select IP Addresses.
- For the Source IP address, enter 10.0.0.4.
- For the Destination, keep Any.
- For the Destination port range, enter 1433.
- For the Priority, enter 102.
- For the Name, enter Port_1433_Paw.
- Select Add.
- Configure the web server to allow all HTTP and HTTPS connections:
- Select Network Security Groups.
- Select WebTrafficOnly.
- Select Inbound Security Rules.
- Select +Add.
- For the Source, keep Any.
- For the Destination, keep Any.
- For the Destination port ranges, enter 80,443.
- For the Priority, enter 100.
- Change the Name to Port_80_443.
- Select Add.
- Configure both the database and web server to only allow RDP connections from the PAW machine:
- Select Network Security Groups. For both the DbTrafficOnly and WebTrafficOnly, do the following:
- Select Inbound Security Rules.
- Select +Add.
- For the Source, select IP Addresses.
- For the Source IP address, enter 10.0.0.4.
- For the Destination port range, enter 3389.
- For the Priority, enter 101.
- For the Name, enter Port_3389.
- Select Add.
- Select Network Security Groups. For both the DbTrafficOnly and WebTrafficOnly, do the following:
- Configure all Network Security Groups to have Diagnostic logs enabled.
- Select Network security groups. For each NSG (DBTrafficOnly and WebTrafficOnly), do the following:
- In the content menu, select Diagnostic logs, and then select Add diagnostic setting.
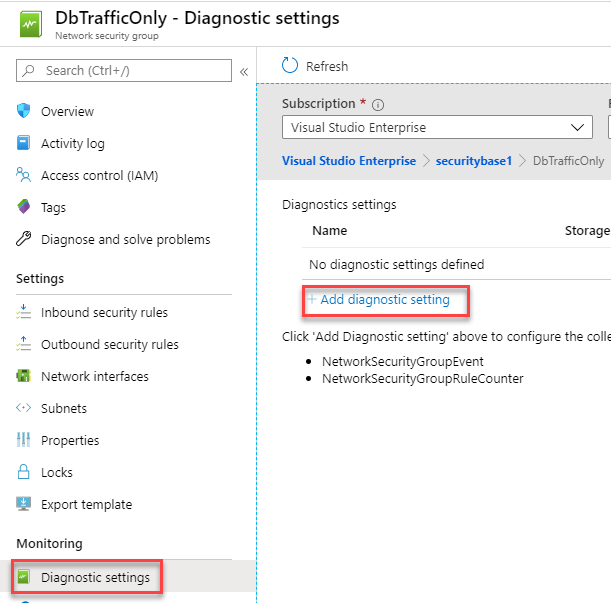 Diagnostics settings is selected under Monitoring on the left side, and Add diagnostics settings is selected on the right.
- For the name, enter the NSG name and then add Logging to the end.
- Check the Send to Log Analytics checkbox, in the Log Analytics box, select Configure.
- Select the azseclog… workspace.
- Select both LOG checkboxes.
- Select Save.
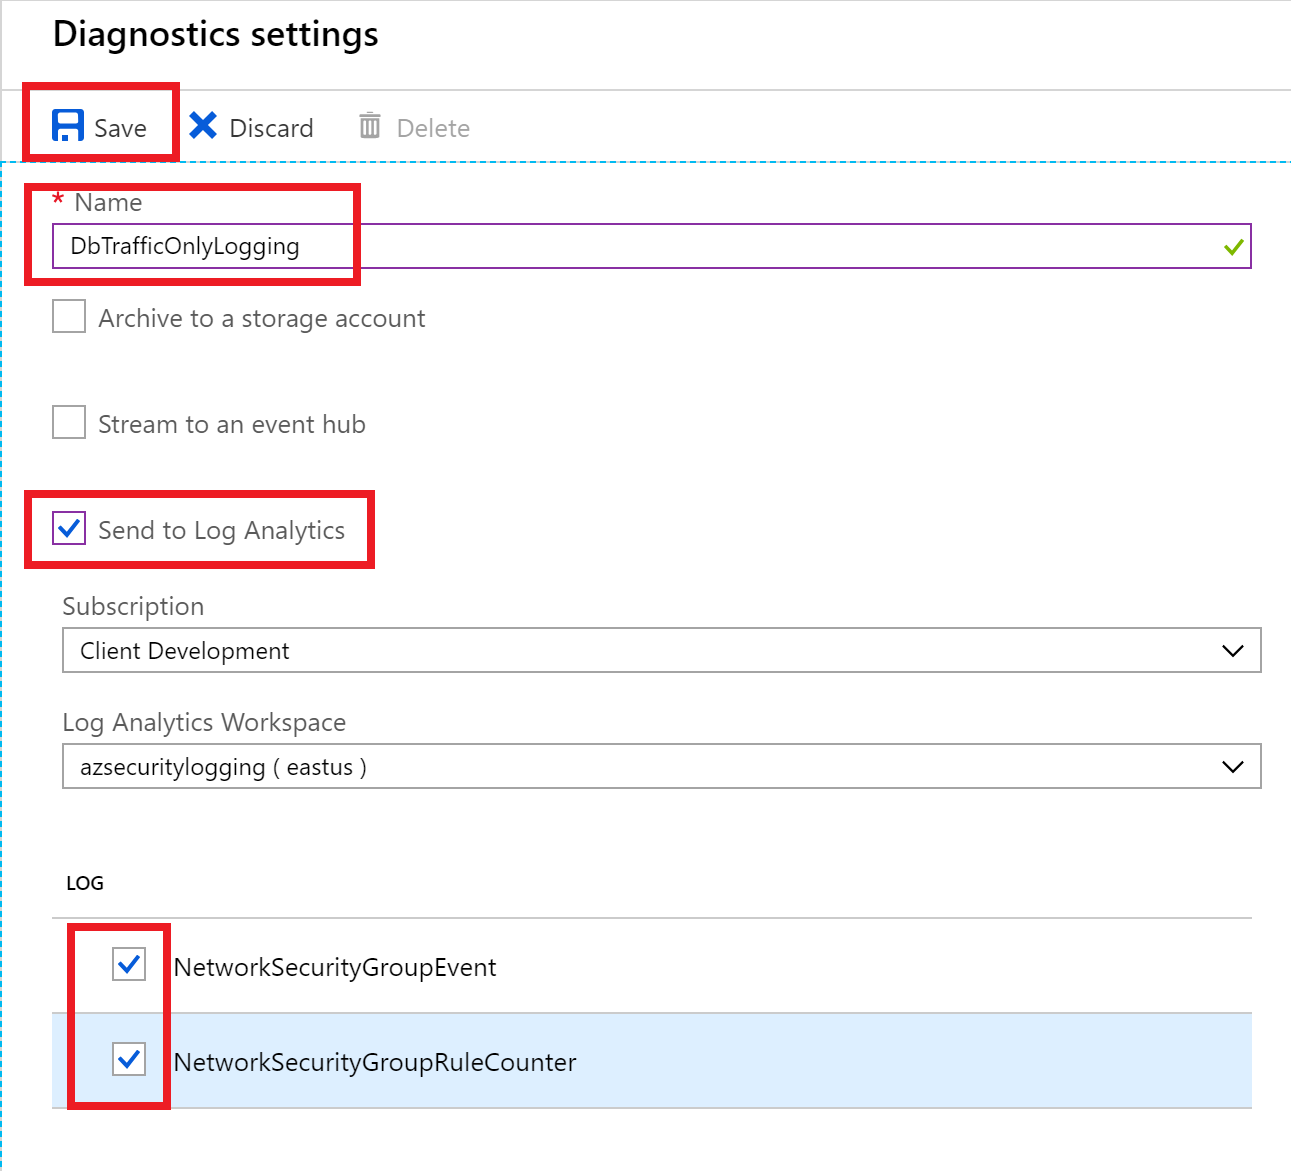 Save is highlighted at the top, and two log items are selected below.
- Select Network security groups. For each NSG (DBTrafficOnly and WebTrafficOnly), do the following:
Task 3: Test network security group rules #2
- Switch back to the paw-1 virtual machine.
- Press F5 to run the PortScan script. You should see the following:
- Port scan for port 3389 (RDP) to db-1 and web-1 is successful from the paw-1 machine.
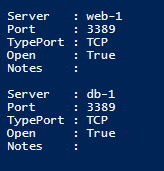 The information above for port 3389 (RDP) is visible after running the script and pressing F5.
- Port scan for port 1433 (SQL) to db-1 is successful, and web-1 is unsuccessful from the paw-1 machine.
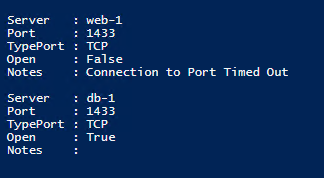 The information above for port 1433 (SQL) is visible after running the script and pressing F5.
- Note: The ARM Template installed IIS on web-1, the port scan for port 80 (HTTP) to web-1 is successful from the paw-1 machine, however to db-1 is unsuccessful as it is not running IIS.
 The information above for port 80 (HTTP) is visible after running the script and pressing F5.
Task 4: Install network watcher VM extension
- Switch to the Azure Portal.
- Select Virtual Machines.
- Select db-1.
- In the blade menu, select Extensions, then select +Add.
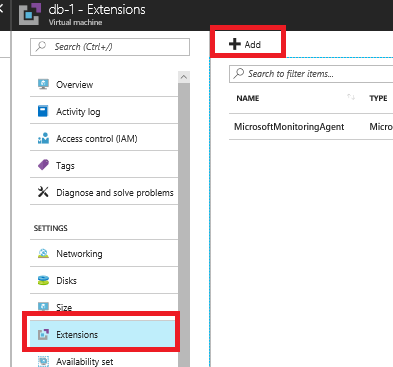 Extensions is selected on the left under Settings, and + Add is highlighted at the top right.
 - Browse to the Network Watcher Agent for Windows, and select it.
- Select Create.
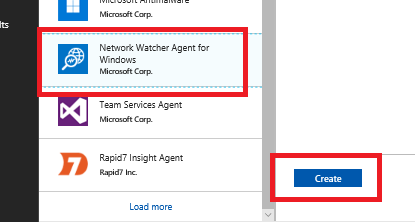 Network Watcher Agent for Windows is highlighted on the left, and Create is highlighted on the right.
 - In the next Install extension dialog window (note that it could be blank) select OK. You should see a dialog toast notification about the script extension being installed into the Virtual Machine.
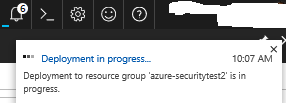 The toast notification states: “Deployment in progress … Deployment to resource group ‘azure-securitytest1’ is in progress.”
Task 5: Setup network packet capture
- In the main Azure Portal menu, search All services for Network Watcher.
- In the context menu, select Network Watcher.
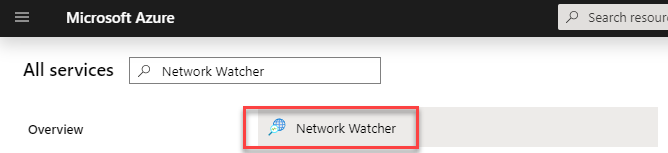 Network watcher is selected from the filtered list of services.
 - Expand the subscription regions item you are running your labs in.
- For the East US region (or whatever region you deployed your VMs too), select the ellipsis, then select Enable network watcher.
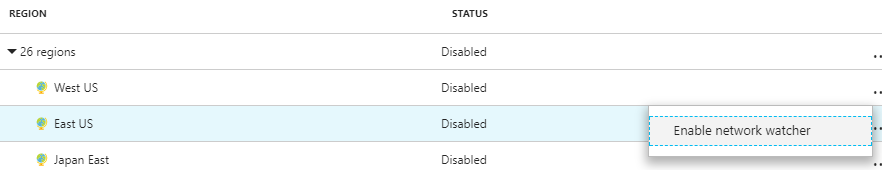 The East US row is highlighted under Region, and Enable network watcher is selected in the submenu.
 - In the new context menu, select Packet capture.
- Select +Add.
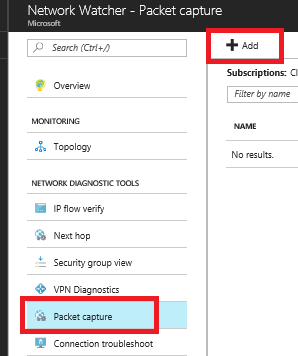 Packet capture is selected and highlighted on the left under Network Diagnostic Tools, and + Add is highlighted at the top right.
 - Select your subscription.
- Select your resource group.
- For the target virtual machine, ensure that db-1 is selected.
- For the capture name, enter databasetraffic.
- Notice the ability to save the capture file to the local machine or an Azure storage account. Ensure that the resource group storage account is selected. If you check your resource group, the storage account is prefixed with “diagstor”.
- For the values, enter the following:
- Maximum bytes per packet: 0.
- Maximum bytes per session: 1073741824.
- Time limit: 600.
 In the Add packet capture window, databasetraffic is entered in the Packet capture name box, and the Storage account check box is checked.
 - Select OK.
Task 6: Execute a port scan
- Switch your Remote Desktop connection to the paw-1 virtual machine.
- Uncomment the following line of the script, and press F5.
#TestPortRange $computers 80 443;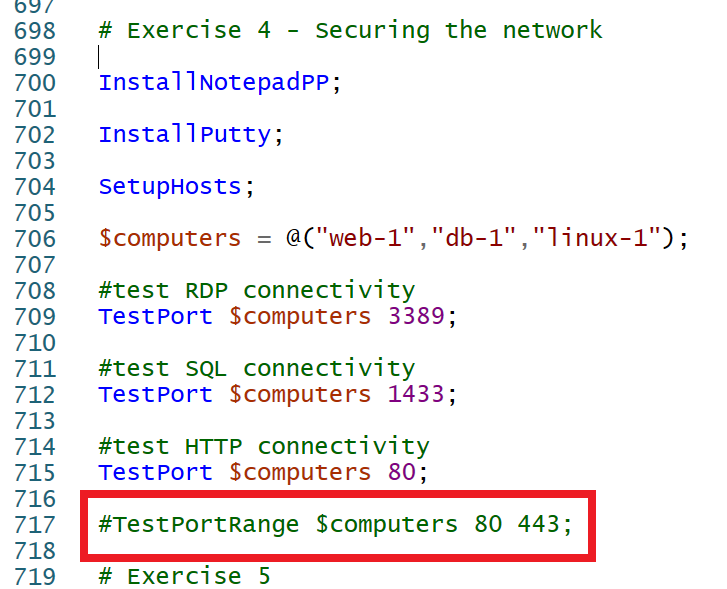 The PowerShell ISE window displays uncommented PowerShell script port scan command.Note: You should see the basic ports scanned, and then a port scan from 80 to 443. This will generate many security center logs for the Network Security Groups which will be used in the Custom Alert in the next set of exercises. Continue to the next exercise while the script executes.
Exercise 5: Azure Security Center
Duration: 45 minutes
Azure Security Center provides several advanced security and threat detection abilities that are not enabled by default. In this exercise we will explore and enable several of them.
Task 1: Linux VM and Microsoft Monitoring Agent (MMA) install
- In the Azure Portal, browse to your azsecurity-INIT resource group, then select the azseclog… Log Analytics Workspace.
 The log analytics workspace is highlighted.
 - In the blade, select Agents management.
- Record the
Workspace IDand thePrimary keyvalues. Agents management blade link is highlighted along with the id and key for the workspace
 - Switch to the Remote Desktop Connection to the paw-1.
- Open the Putty tool, login to the linux-1 machine using the username and password.
 Putty window with linux-1 as the host.
 - Run the following commands, be sure to replace the workspace tokens with the values you records above:
wget https://raw.githubusercontent.com/Microsoft/OMS-Agent-for-Linux/master/installer/scripts/onboard_agent.sh && sh onboard_agent.sh -w <YOUR_WORKSPACE_ID> -s <YOUR_WORKSPACE_KEY> sudo /opt/microsoft/omsagent/bin/service_control restart <YOUR_WORKSPACE_ID> - Switch back to the Azure Portal.
- In the blade menu, select Advanced settings and then select Linux Servers, you should see 1 LINUX COMPUTER CONNECTED.
 The displayed of connected linux computers for the workspace.Note: In most cases, Azure will assign resources automatically to the log analytics workspace in your resource group.
Task 2: Execute brute force attack
- Switch to the Remote Desktop Connection to the paw-1.
- In the PowerShell ISE, comment the lines for Exercise 4, then uncomment the lines for Exercise 5.
- Run the script, notice how it will execute several attempts to login via SSH to the linux-1 machine using the plink tool from putty.
- After a few moments (up to 30 mins), you will see an alert from Security Center about a successful brute force attack.
 The email warning about the Brute Force Attack.
Task 3: Enable change tracking and update management
- Switch back to the Azure Portal.
- In the search menu, type Virtual Machine, then select it.
- Highlight the paw-1, web-1, db-1 and linux-1 virtual machines that were deployed.
- In the top menu, select Services, then select Change Tracking.
 The virtual machines are selected and the change tracking menu item is selected.
 - Select the CUSTOM radio button.
- Select change, select the Log Analytics Workspace that was deployed with the lab ARM template.
 The change tracking blade is displayed with custom and change link highlighted.
 - Select the log analytics workspace for your resource group and then select the matching automation account, then select OK.
 The custom configuration dialog is displayed with the log analytics workspace select along with the matching automation account.
 - Select all the virtual machines, then select Enable.
- Navigate back to the Virtual Machines blade, again highlight the paw-1, web-1, db-1 and linux-1 virtual machines that were deployed.
- In the top menu, select Services, then select Inventory.
- Select the CUSTOM radio button.
- Select change, select the Log Analytics Workspace that was deployed with the lab ARM template.
- Notice that all the VMs are already enabled for the workspace based on the last task.
- Navigate back to the Virtual Machines blade, again, highlight the paw-1, web-1, db-1 and linux-1 virtual machines that were deployed.
- In the top menu, select Services, then select Update Management.
- Select the CUSTOM radio button.
- Select change, select the Log Analytics Workspace that was deployed with the lab ARM template.
- Select all the virtual machines, then select Enable.
- Browse to your resource group, then select your Log Analytics workspace.
- Under the General section, select the Solutions blade, you should see the ChangeTracking and Updates solutions were added to your workspace. Select the ChangeTracking solution.
 The solutions configured for the workspace are displayed.
 - Under Workspace Data Sources section, select Solution Targeting (Preview).
- Remove any scopes that are displayed via the ellipses to the right of the items.
- Repeat the steps to remove the solution targeting for the Updates solution.
Task 4: Review MMA configuration
- Switch to the Remote Desktop Connection to the paw-1.
- Open Event Viewer.
- Expand the Applications and Services Logs, then select Operations Manager.
- Right-click Operations Manager, select Filter Current Logs.
 The event viewer is displayed with the click path highlighted.
 - For the event id, type 5001, select the latest entry, you should see similar names to all the solutions that are deployed in your Log Analytics workspace including the ones you just added:
 The event viewer is displayed with the click path highlighted.
 - Open Windows Explorer, browse to C:FilesMonitoring AgentService StatePacks folder.
- Notice the management packs that have been downloaded that correspond to the features you deployed from Azure Portal.
 The management packs for the solutions are displayed.
Task 5: Adaptive Application Controls
- Switch to the Azure Portal.
- Select Azure Security Center.
- In the blade menu, scroll to the ADVANCED CLOUD DEFENSE section and select Adaptive application controls.
- You will likely have several groups displayed, find the one that has your newly created lab VMs.
 Machine groupings is displayed.
 - Expand the Publisher whitelisting rules section, you should see that Google Chrome and Notepad++ were picked up and have Microsoft Certificated tied to them.
 The discovered applications are displayed.
 - In the top menu, select Group settings.
- Review the available settings.
Note: As of June 2020, the Enforce option is temporarily disabled.
Task 6: File Integrity Monitoring
- Switch to the Azure Portal.
- Select Azure Security Center.
- In the blade menu, scroll to the ADVANCED CLOUD DEFENSE section and select File Integrity Monitoring.
- For the log workspace tied to your lab environment virtual machines, if displayed, select Upgrade Plan, then select Try File Integrity Monitoring.
- Select the workspace only, then select Upgrade.
- Select the Continue without installing agents link.
 The continue without installing agents link is highlighted.
 - If displayed, select Enable, otherwise simply select the workspace.
- In the menu, select Settings.
 The Settings link is highlighted.
 - Select the Windows Files tab.
- Select +Add.
- For the item name, type HOSTS.
- For the path, type c:\*.
- Select Save.
 The settings page is displayed with the links highlighted.
 - Select the File Content tab.
- Select Link, then select the storage account tied to your lab.Note: It will take 30-60 minutes for Log Analytics and its management packs to execute on all your VMs. As you may not have that much time with this lab, screen shots are provided as to what results you will eventually get.
 The file content page is displayed with the links highlighted.
 - Switch to the Remote Desktop Connection to the paw-1.
- Open the **c:* file.
- Add the following entry:
10.0.0.6 linux-1 - Save the file.
- After about 30-60 minutes, the Log Analytics workspace will start to pick up changes to your files, registry settings and windows services:
 The file changes are saved to the logs of the workspace.
 - You will also start to see the file snapshots show up in the storage account:
 The file changes are displayed in the storage account.
Task 7: Disk encryption
- Switch to the Azure Portal.
- Browse to your resource group.
- Browse to your key vault.
- In the blade menu under Settings, select Access Policies.
- Select the Azure Disk Encryption for volume encryption checkbox.
 The click path above is highlighted.
 - Select Save.
- Browse to your resource group.
- Select the linux-1 virtual machine.
- In the blade menu, select Disks.
- In the top menu, select Encryption.
 The click path above is highlighted.
 - For Disks to encrypt, select OS Disk.
- Select the Select a key vault and key for encryption link.
- Select the lab key vault.
- For the key, select Create new.
- For the name, type vm-disk-key.
- Select Create.
 Select the lab key vault.
 - For the Version, select the new version.
- Select Select.
- Select Save, then select Yes when prompted.
Note: Disk encryption can take some time, move on to the next exercises.
Exercise 6: Azure Sentinel logging and reporting
Duration: 20 minutes
In this exercise, you will setup Azure Sentinel to point to a logging workspace and then create custom alerts that execute Azure Runbooks.
Task 1: Create a dashboard
- Open the Azure Portal.
- Select All services, then type Sentinel, select Azure Sentinel.
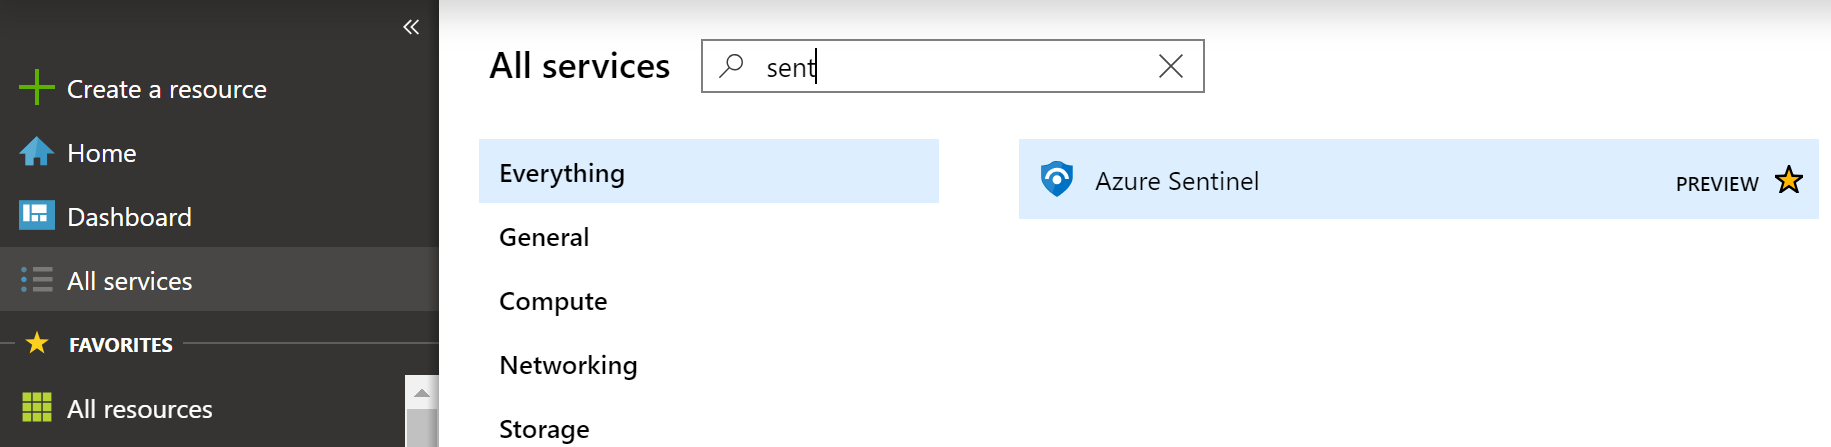 All Services is selected in the left menu, and a search for Sentinel is displayed along with its search results.
 - In the blade, select +Add, select the Log Analytics resource for your resource group, then choose Add Azure Sentinel.
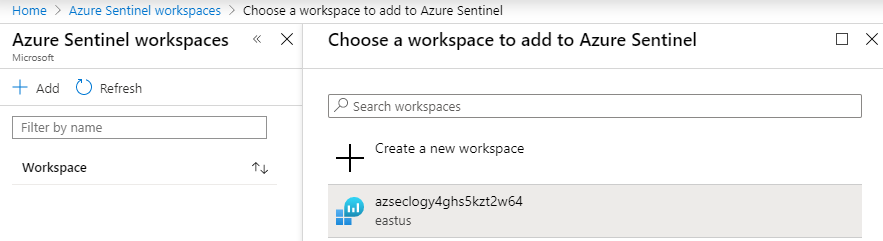 The screenshot displays the Azure workspace found in the resource group.
 - In the blade, under Threat Management, select Workbooks.
- In the list of workbooks, select Azure AD Audit logs, select Save.
- Select the region and select OK.
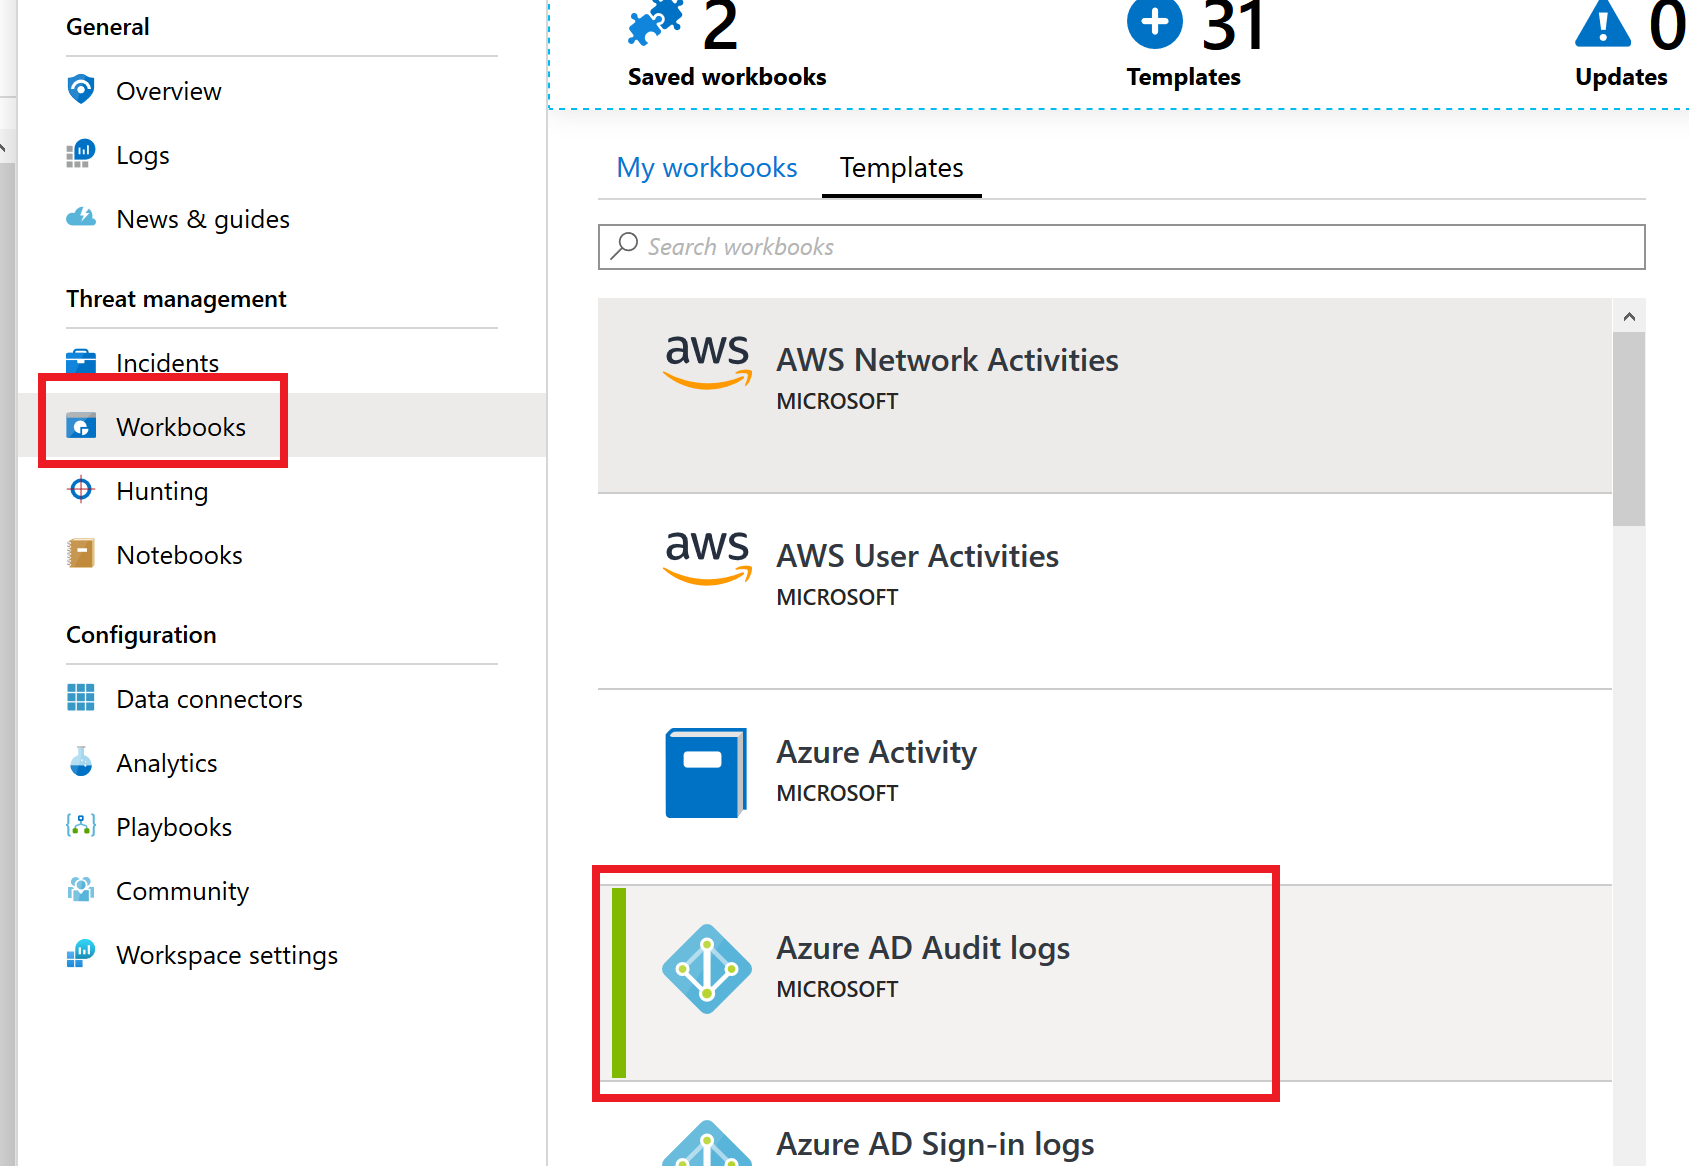 In the left menu beneath Threat Management the Workbooks item is selected and the Azure AD Audit Logs item is selected beneath the Templates tab on the right.
 - In the list of workbooks, select Azure Network Watcher, choose Save.
- Select the region and choose OK.
- Select View saved workbook, take a moment to review your new workbook.Note: You may not have data in the log analytics workspace for the targeted workbook queries.
Task 2: Create an Analytics alert
- Navigate back to the Azure Sentinel workspace, in the Configuration blade section, select Analytics then select +Create then Scheduled query rule.
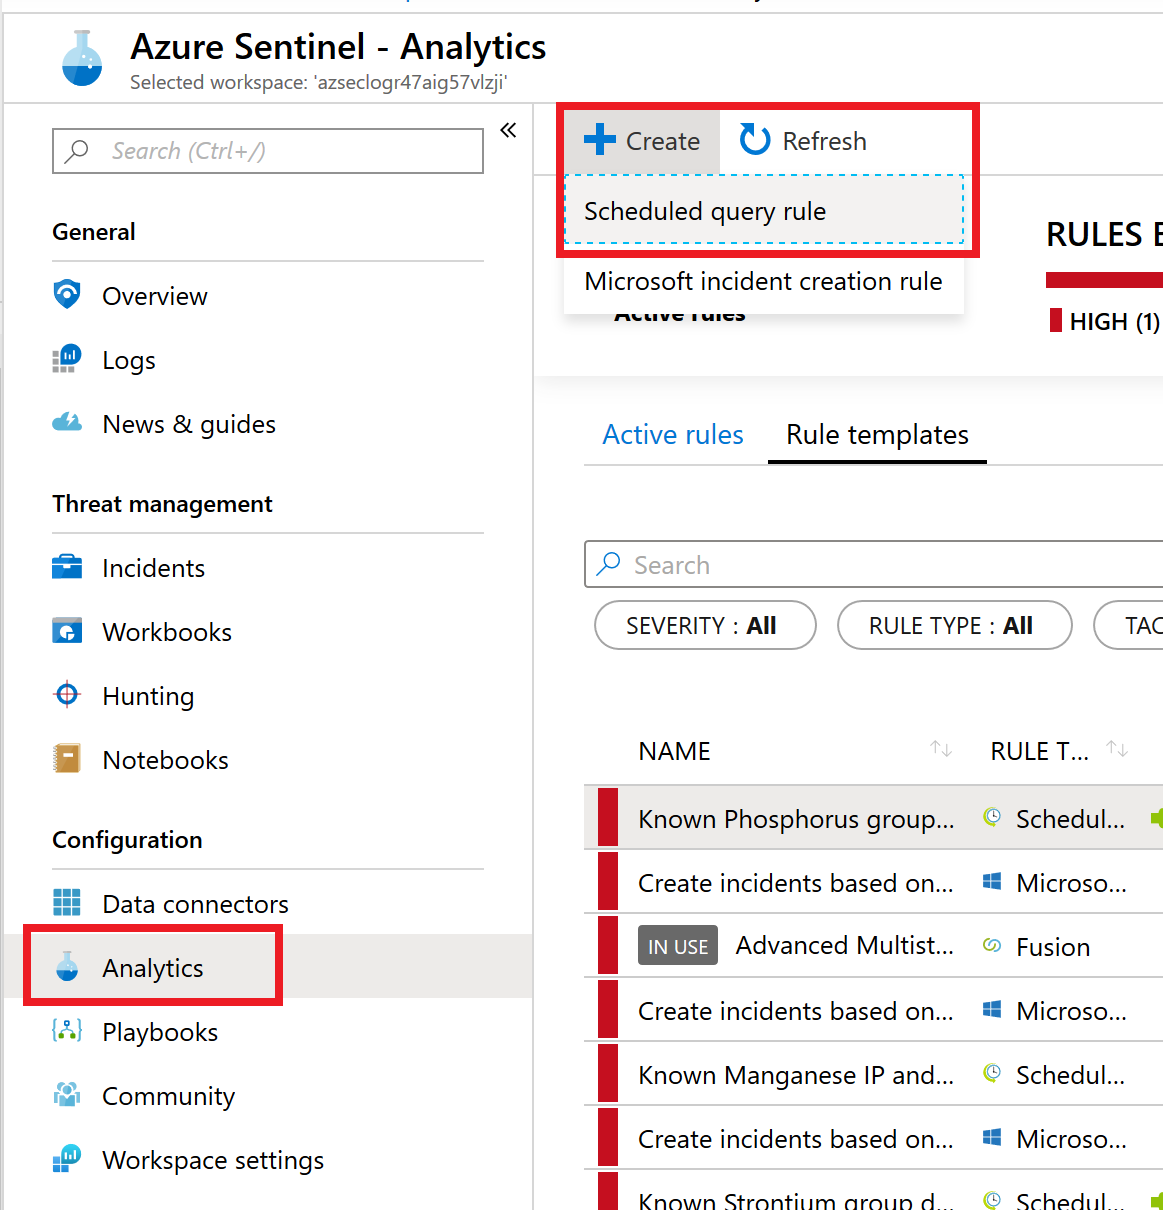 In the left menu beneath Configuration the Analytics item is selected. To the right, the + Create button is expanded and the Scheduled query rule item is selected.
 - On the General tab, enter PortScans for the name.
- For the description, enter A custom rule to detect port scans, select Next: Set rule logic.
- In the Rule query text box, type:
AzureDiagnostics | where ruleName_s == 'UserRule_DenyAll' and Type != 'AzureMetric' and type_s == 'block' and direction_s == 'In' and OperationName == 'NetworkSecurityGroupCounters' | summarize AggregatedValue = sum(matchedConnections_d) by ruleName_s, primaryIPv4Address_s | where AggregatedValue > 0Note: If you wanted to target a specific NSG, you can addand Resource == 'WEBTRAFFICONLY'to the query.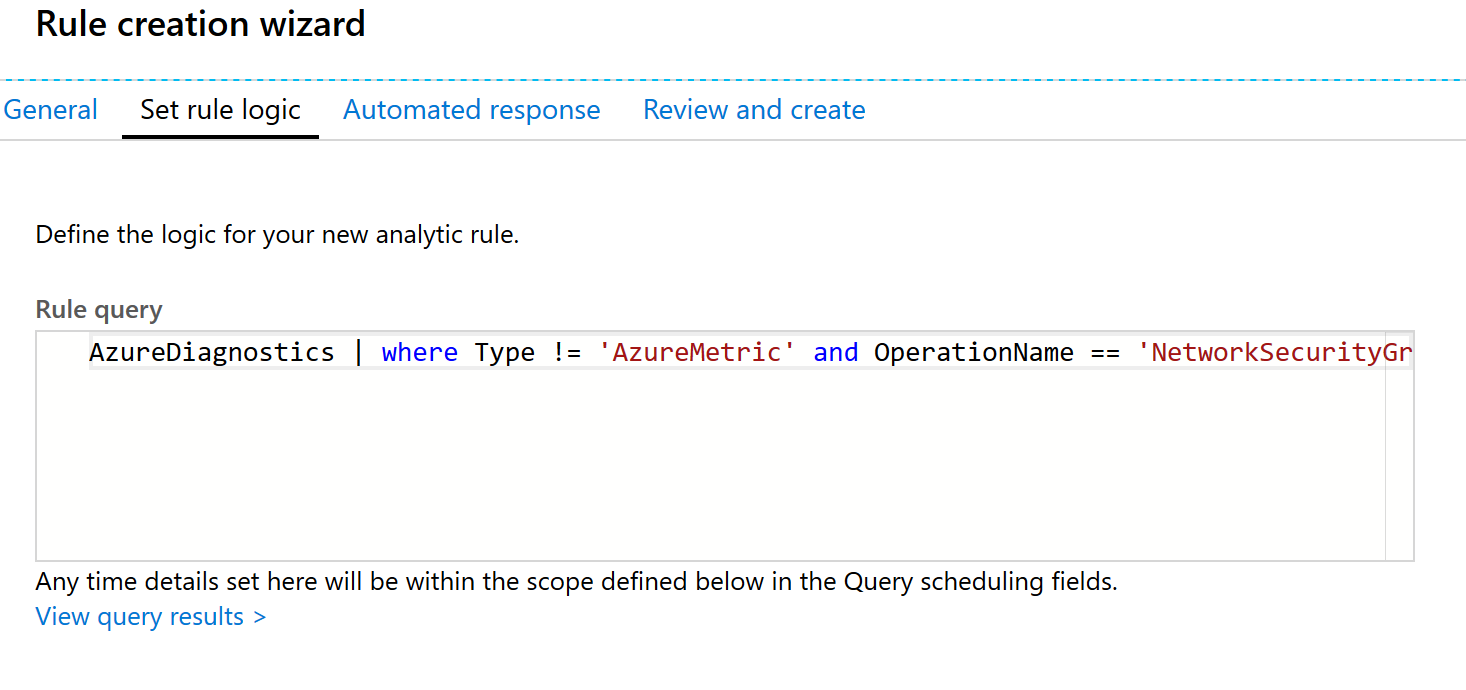 In this screenshot, the alert simulation shows data after the query has been entered.Note: If you were quick going through the labs, then you may not have log data in the Log Analytics workspace just yet that corresponds to “AzureMetric”. You may need to wait 15-30 minutes before a query will execute.Note: Since the introduction of Azure Security Center and Sentinel, the backend logging has changed a few times as well as the way the calculations are done in the rule query (timespan in query vs outside query, etc.). The ultimate goal of this query is to find when a series of failed connection attempts have been made against a network security group and a specific deny rule. If for some reason the UI/backend has been modified since the last published lab, modify the query to accomplish this goal.
 - Under Map entities, for the IP, select the primaryIPv4Address_s column, then select Add.
- Under Query scheduling, for the Run query every setting, type 5 minutes.Note: This is a lab and you want to see the results as quickly as possible. In a production environment, you may want to choose a different time threshold.
- For the Lookup data from the last, type 2 hours.
- Under Alert threshold, for the Generate alert when number of query results, enter 0.Note: We want to hit the threshold quickly for lab purposes. This query and value may not be appropriate for production and is only for learning purposes.Review the current data to determine what would trigger the alert. Notice the red threshold line intersects the blue event data line.
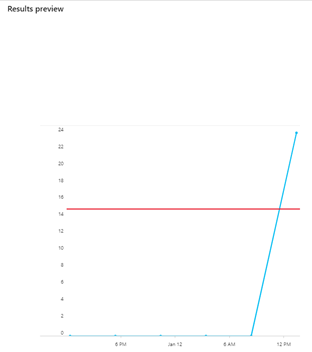 A chart is displayed showing the current log data and the alert threshold. The red and blue line intersect in the chart.
 - Select Next: Incident settings, review the potential incident settings.
- Select Next: Automated response, notice you have no playbooks to select yet.
- Select Next: Review.
- Select Create.Note: It may take a few minutes for the alert to fire. You may need to run the PortScan script a few times from paw-1
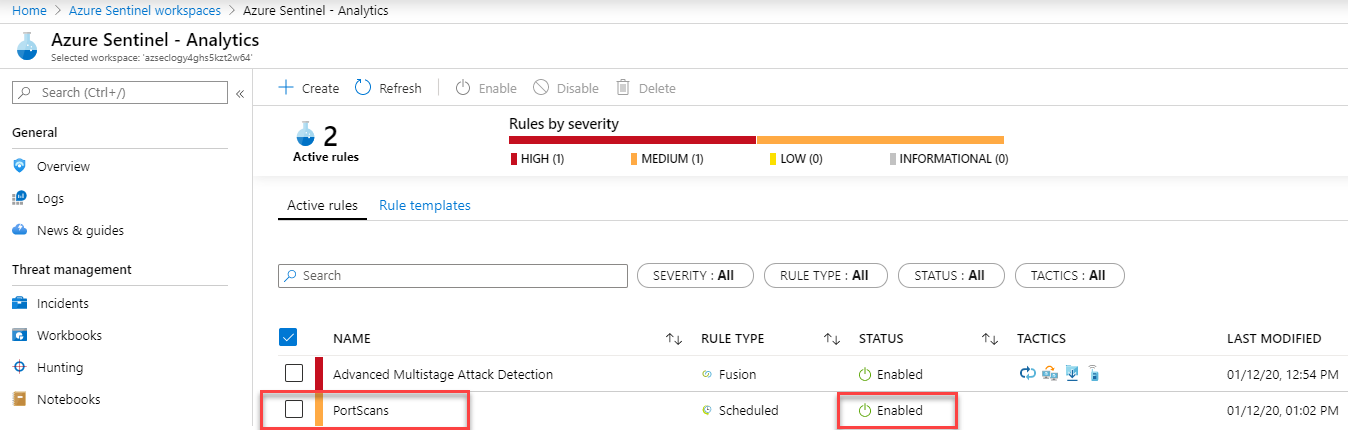 In the Azure Sentinel Analytics screen beneath the Active Rules tab, the PortScans rule is highlighted in the table and its status shows it is Enabled.
Task 3: Investigate a custom alert incident
- In the main menu, select Azure Sentinel.
- Select Incidents.
- Select the new PortScans incident.
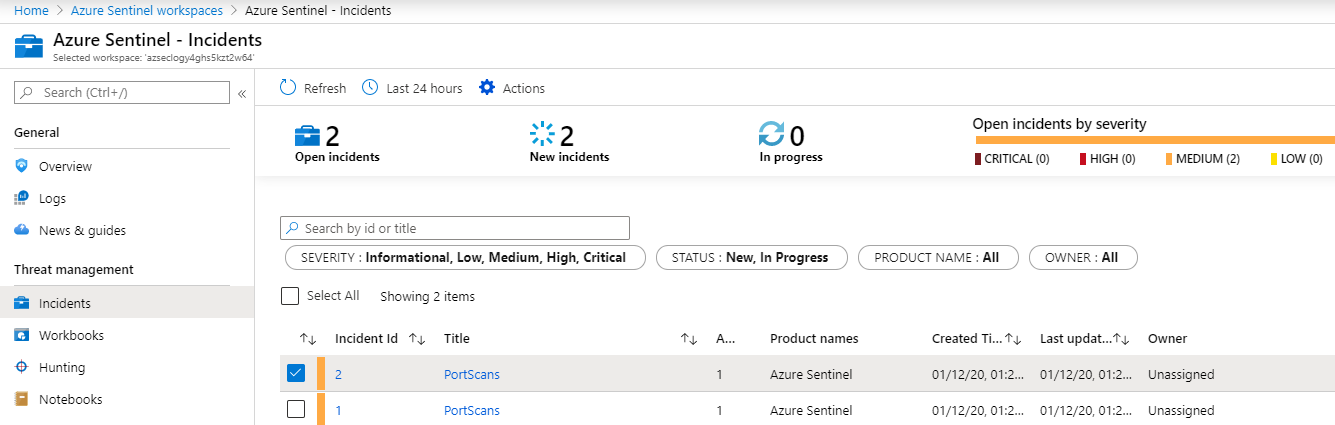 In the Azure Sentinel Incidents window, the most recent PortScans security alert is selected from the table.Note: It may take 15-20 minutes for the alert to fire. You can continue to execute the port scan script to cause log events or you can lower the threshold for the custom alert.
 - In the dialog, choose Investigate. Note that it may take a few minutes for the button to be available.
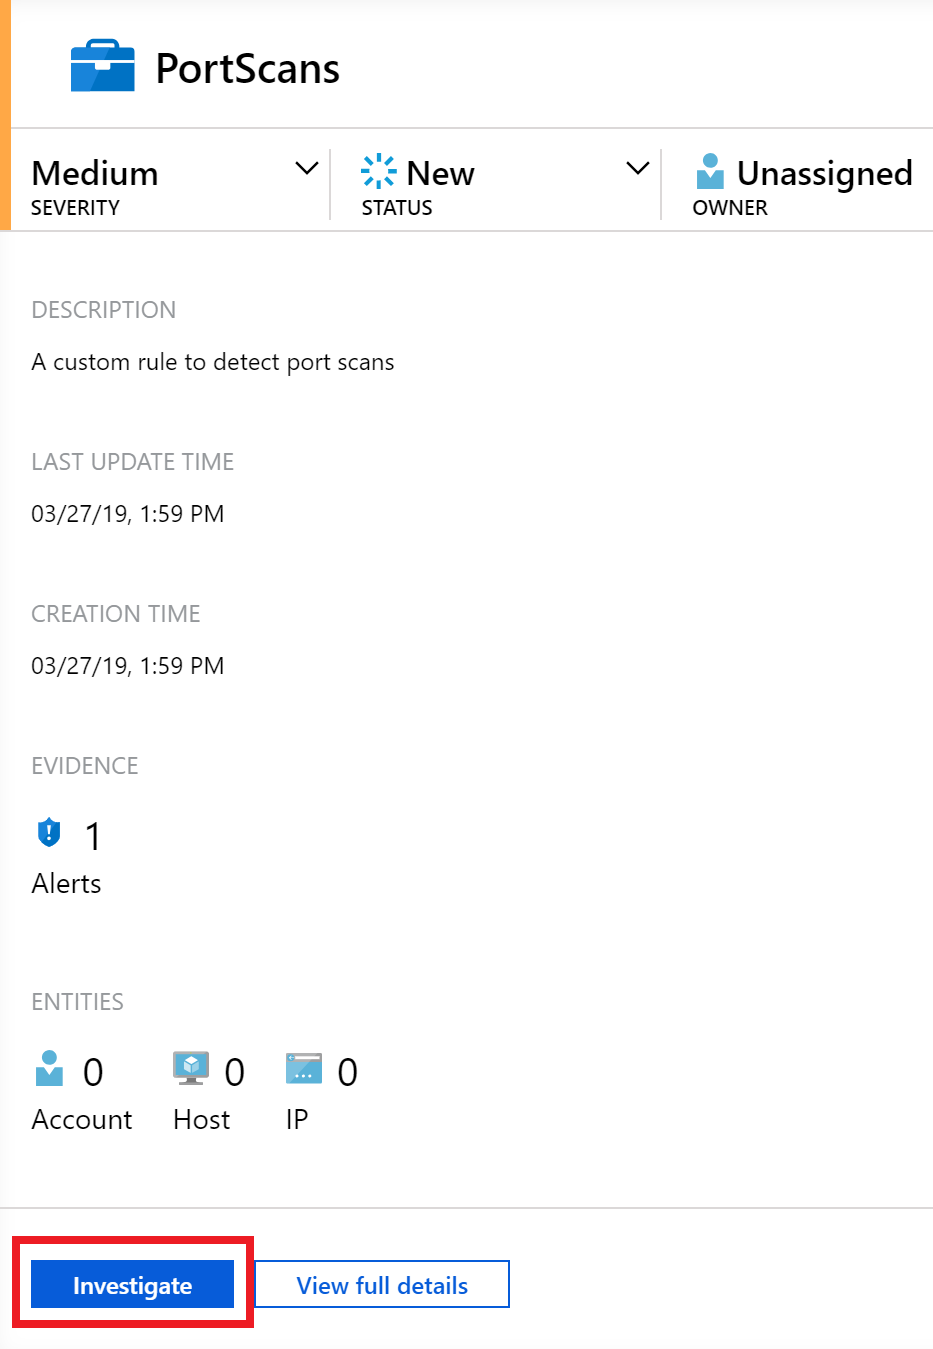 The incident dialog is displayed with the Investigate button selected.
 - In future versions, you will get to see insights about the alerts and the resources related to what caused it to fire:
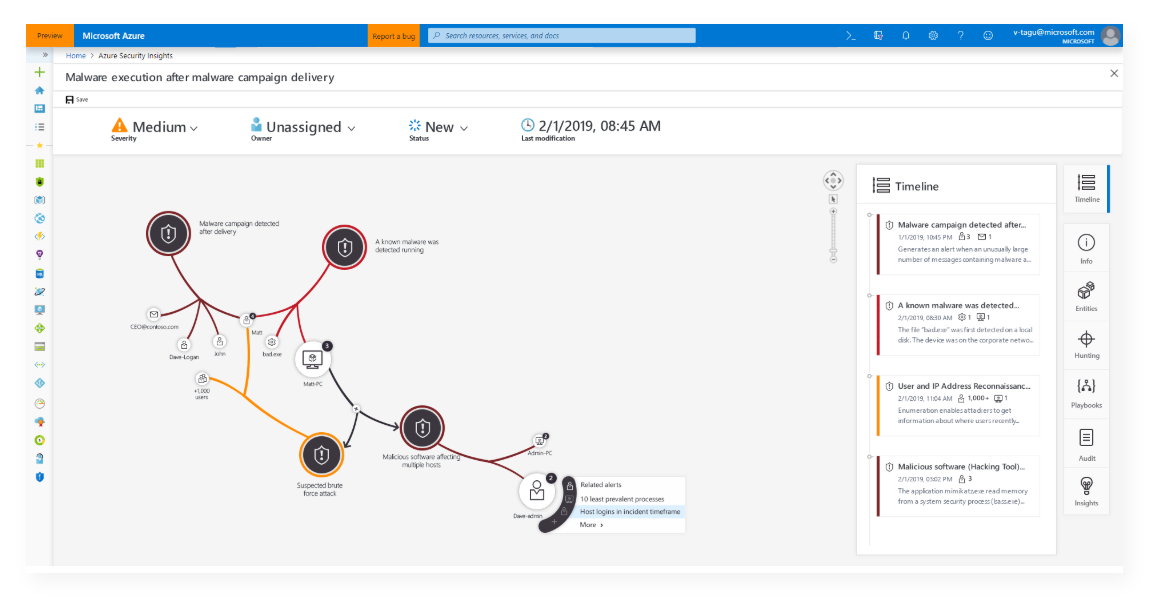 The Azure Security Insights screen is displayed detailing the lifetime of an alert instance.
Task 4: Create and run a playbook
- In the Azure Sentinel blade, select Playbooks.
- In the new window, select + Add Playbook.
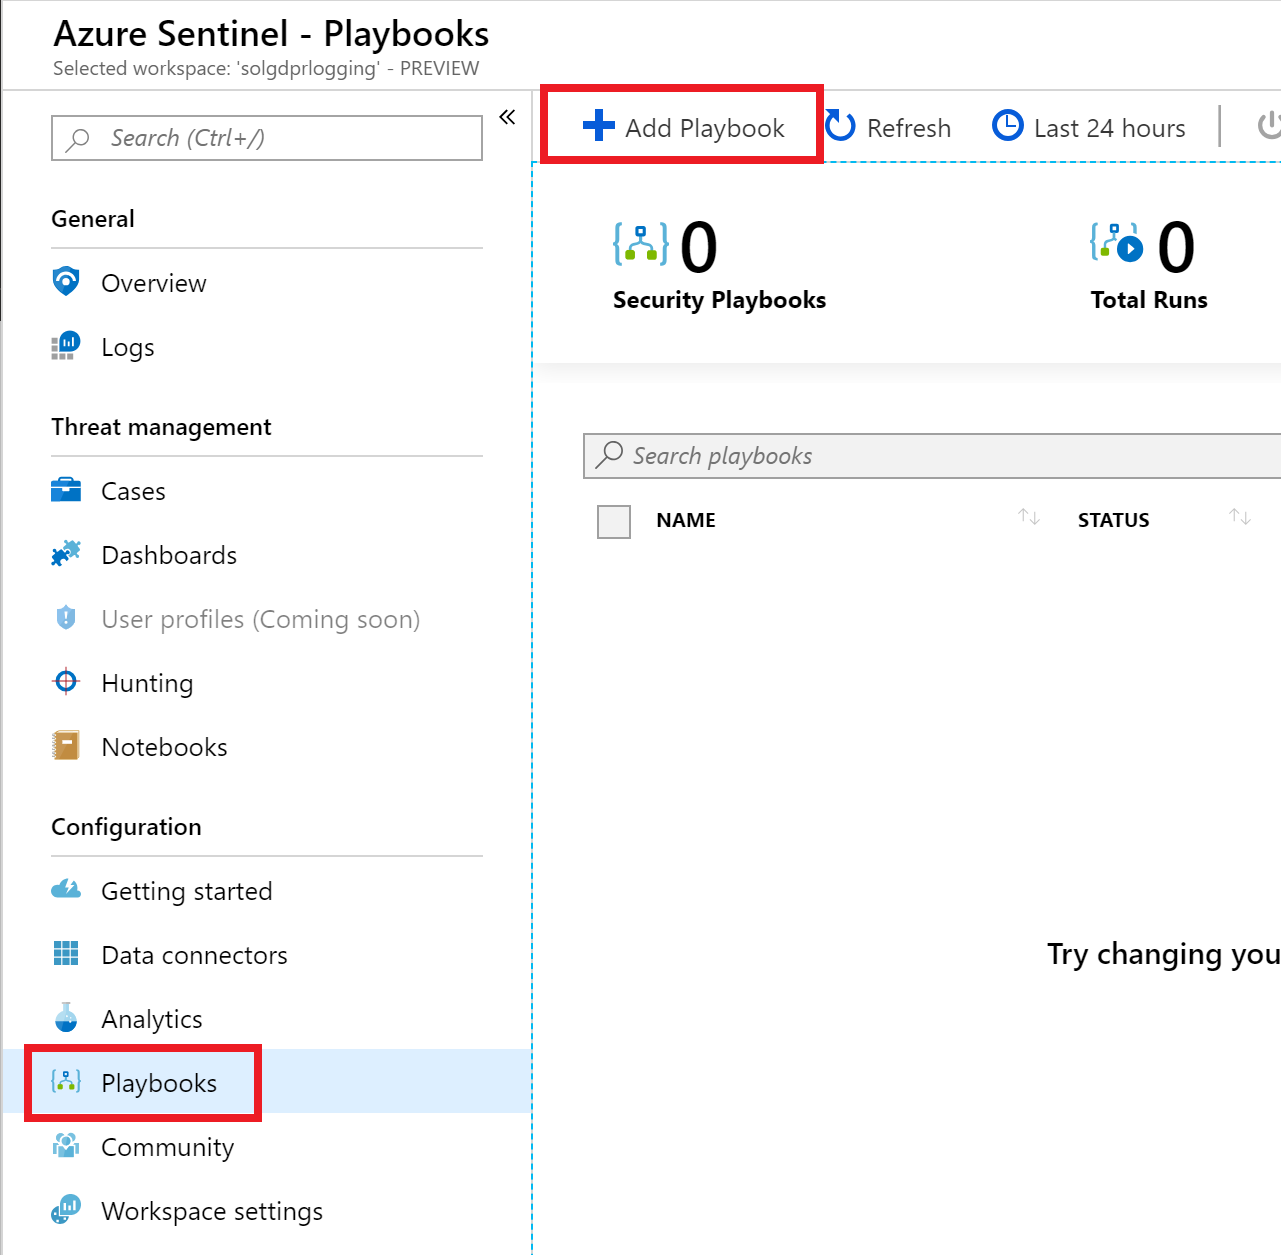 The playbooks blade is displayed with the Playbooks item selected in the left hand menu and the + Add Playbook button selected.
 - The Create logic app blade will display:
- For the name, enter Email.
- Select your existing resource group.
- Toggle the Log Analytics to On and then select your azuresecurity Log Analytics workspace.
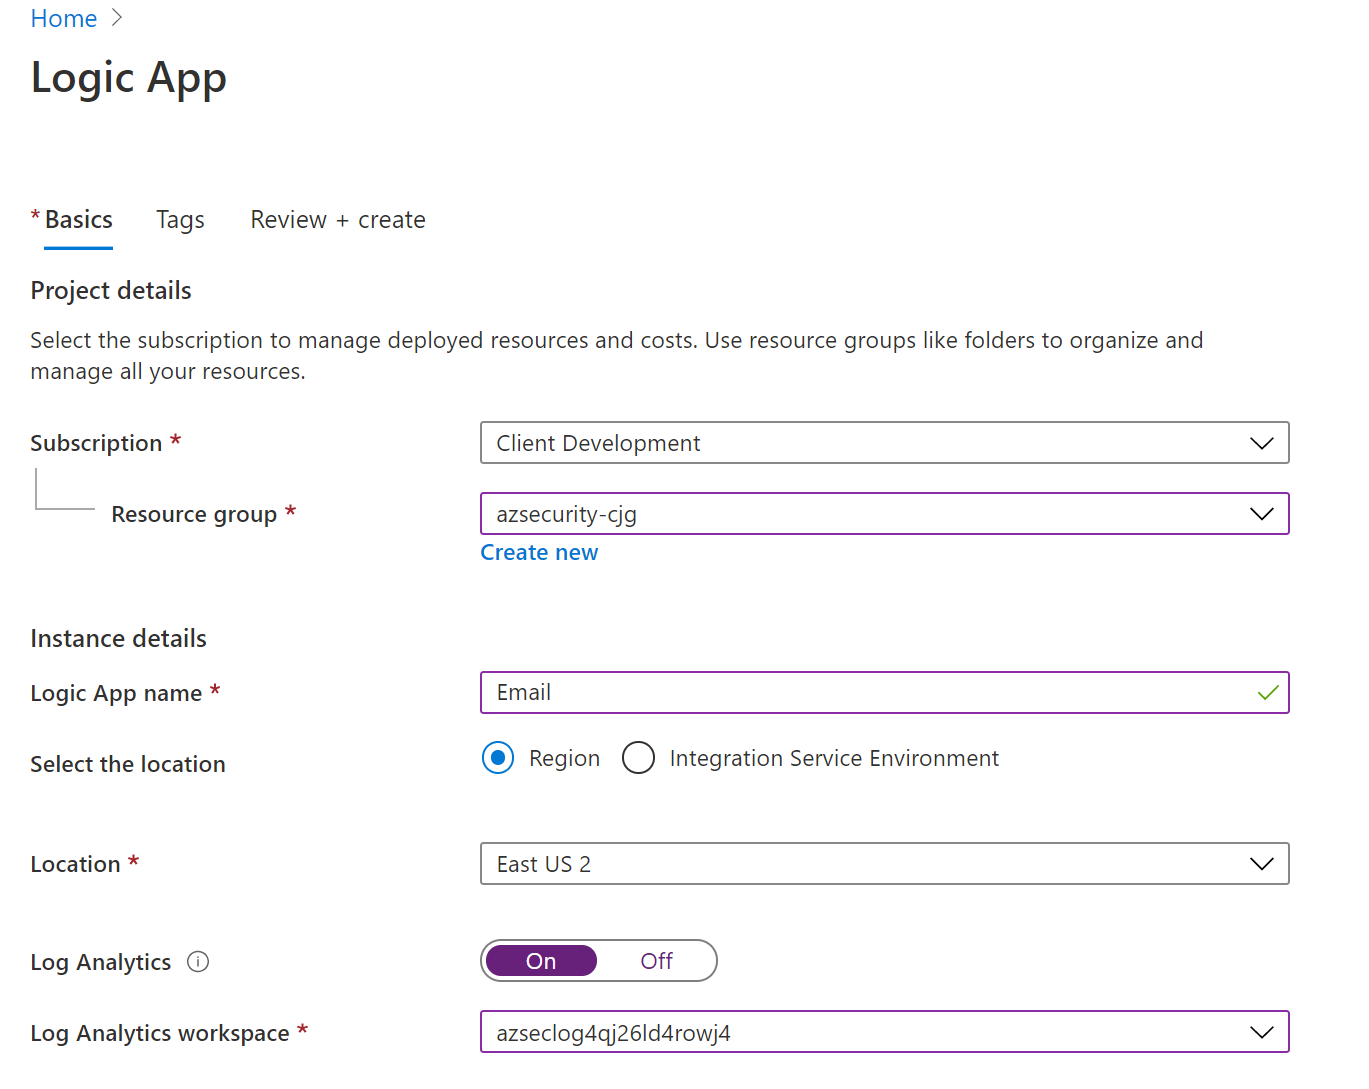 The information above is entered in the Create logic app blade.
 - Select Review + Create then select Create. After a few moments, the Logic Apps Designer will load. If the designer does not load, wait a few minutes and refresh the Playbook list. Select the Email playbook.
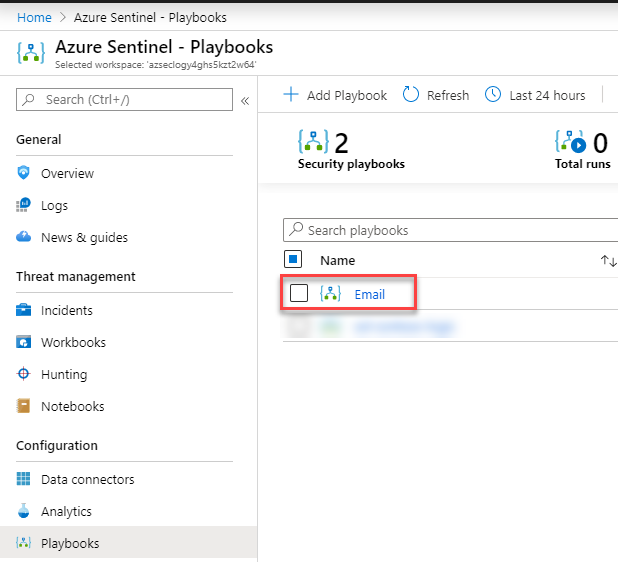 The playbooks list is displayed and the Email playbook is highlighted.
 - Select the Get a notification email when Security Center detects a threat template.
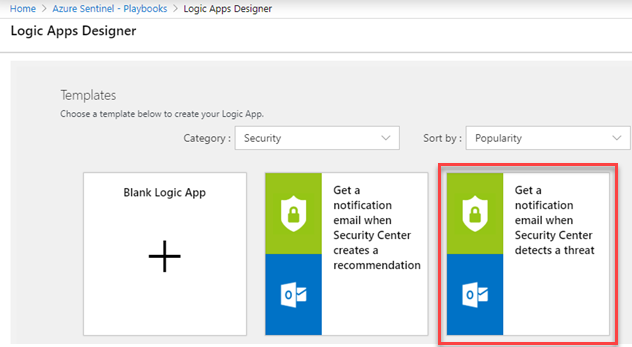 The Logic Apps Designer screen is displayed with a list of templates. The Get a notification email when Security Center detects a threat template is selected.
 - Select Use this template.
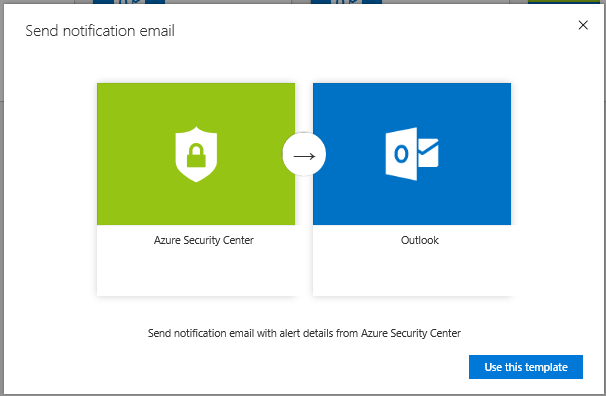 The Use this template button is selected under Send notification email with alert details from Azure Security Center.
 - For the Office 365 Outlook connection, select the + link, enter your Azure/O365 credentials.
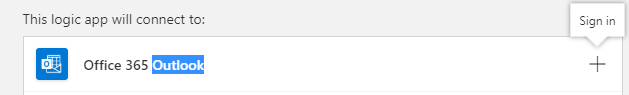 The Sign in button is highlighted next to Office 365 Outlook under This logic app will connect to.Note: This would need to be a valid Office 365 account, if you do not have a valid Office 365 account, then utilize a basic email template for Outlook.com.
 - For the Security Center Alert connection, select the + link.
- Select Continue.
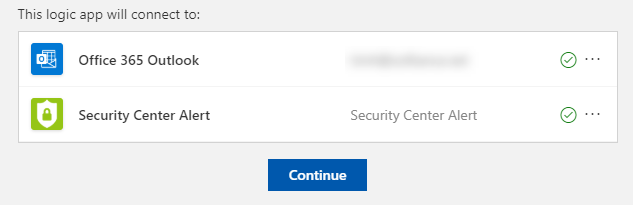 The Logic app connection blade is displayed. Outlook and Azure Security Center validation are displayed.
 - For the email address, enter your email.
- Select Save. You now have an email alert action based on LogicApps for your custom security alert to use.
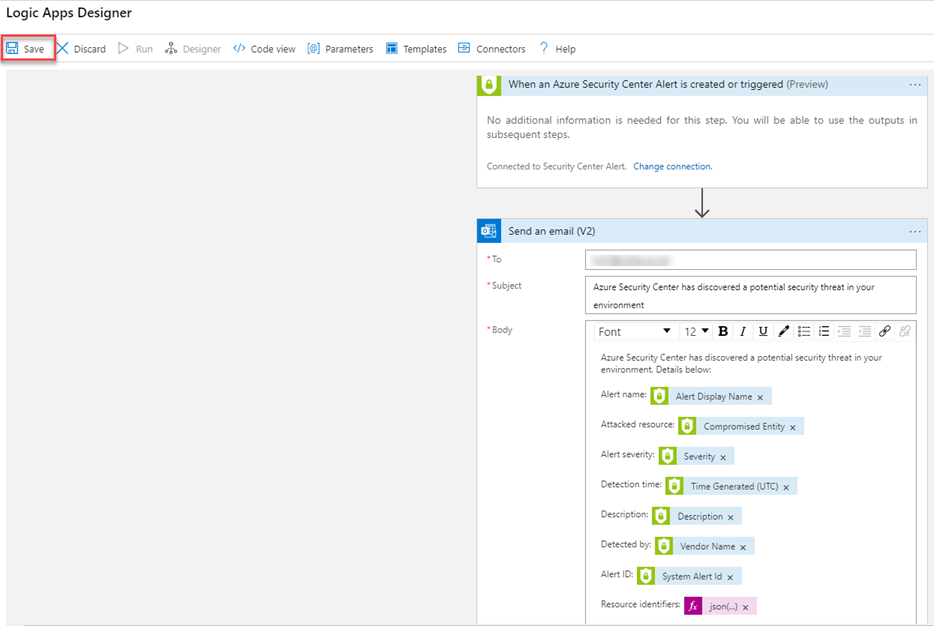 Save is highlighted in Logic Apps Designer, and information about the custom security alert appears below.
 - Lastly, after you have created the new Playbook, ensure that the status is Enabled. If not, then select Enable in the menu.
Task 5: Execute Jupyter Notebooks
- In the Azure Sentinel blade, select Notebooks.
- Search for the Getting Started with Azure Sentinel Notebooks item.
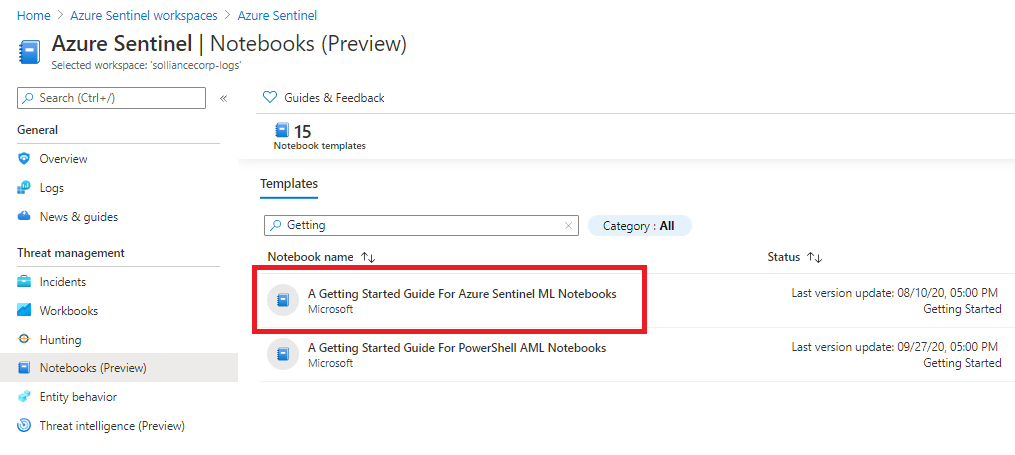 The notebook search results are displayed.
 - In the right dialog, select Launch Notebook.
- If not already logged in, select your Azure credentials, the GitHub repo will start to clone into your workspace. You will see the GitHub progress meter.
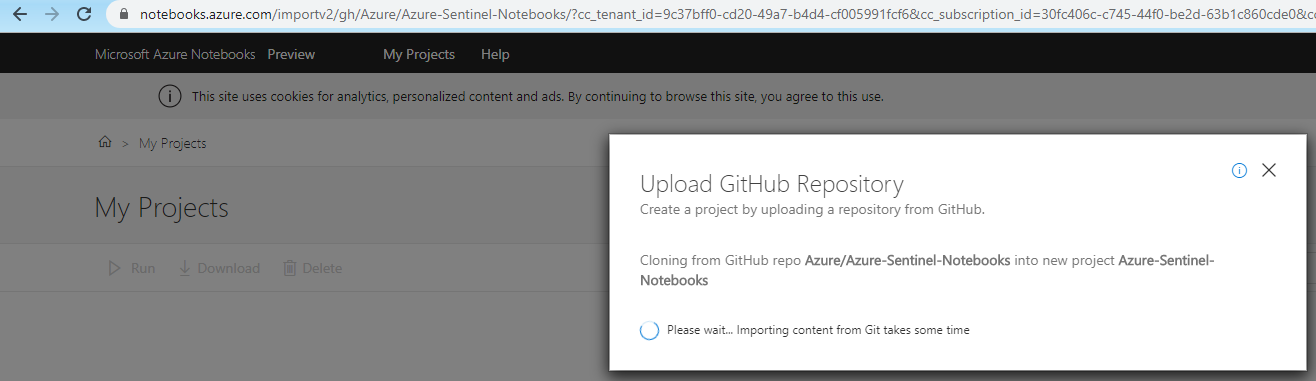 The GitHub progress meter is displayed.
 - The notebook should open in the Jupyter notebooks application. It will also start a container kernel for executing the notebook cells.
- Follow the directions of the notebook while executing each cell. The notebook will required you to setup some supported API accounts to merge external security data such as known bad actors and other geographical information.
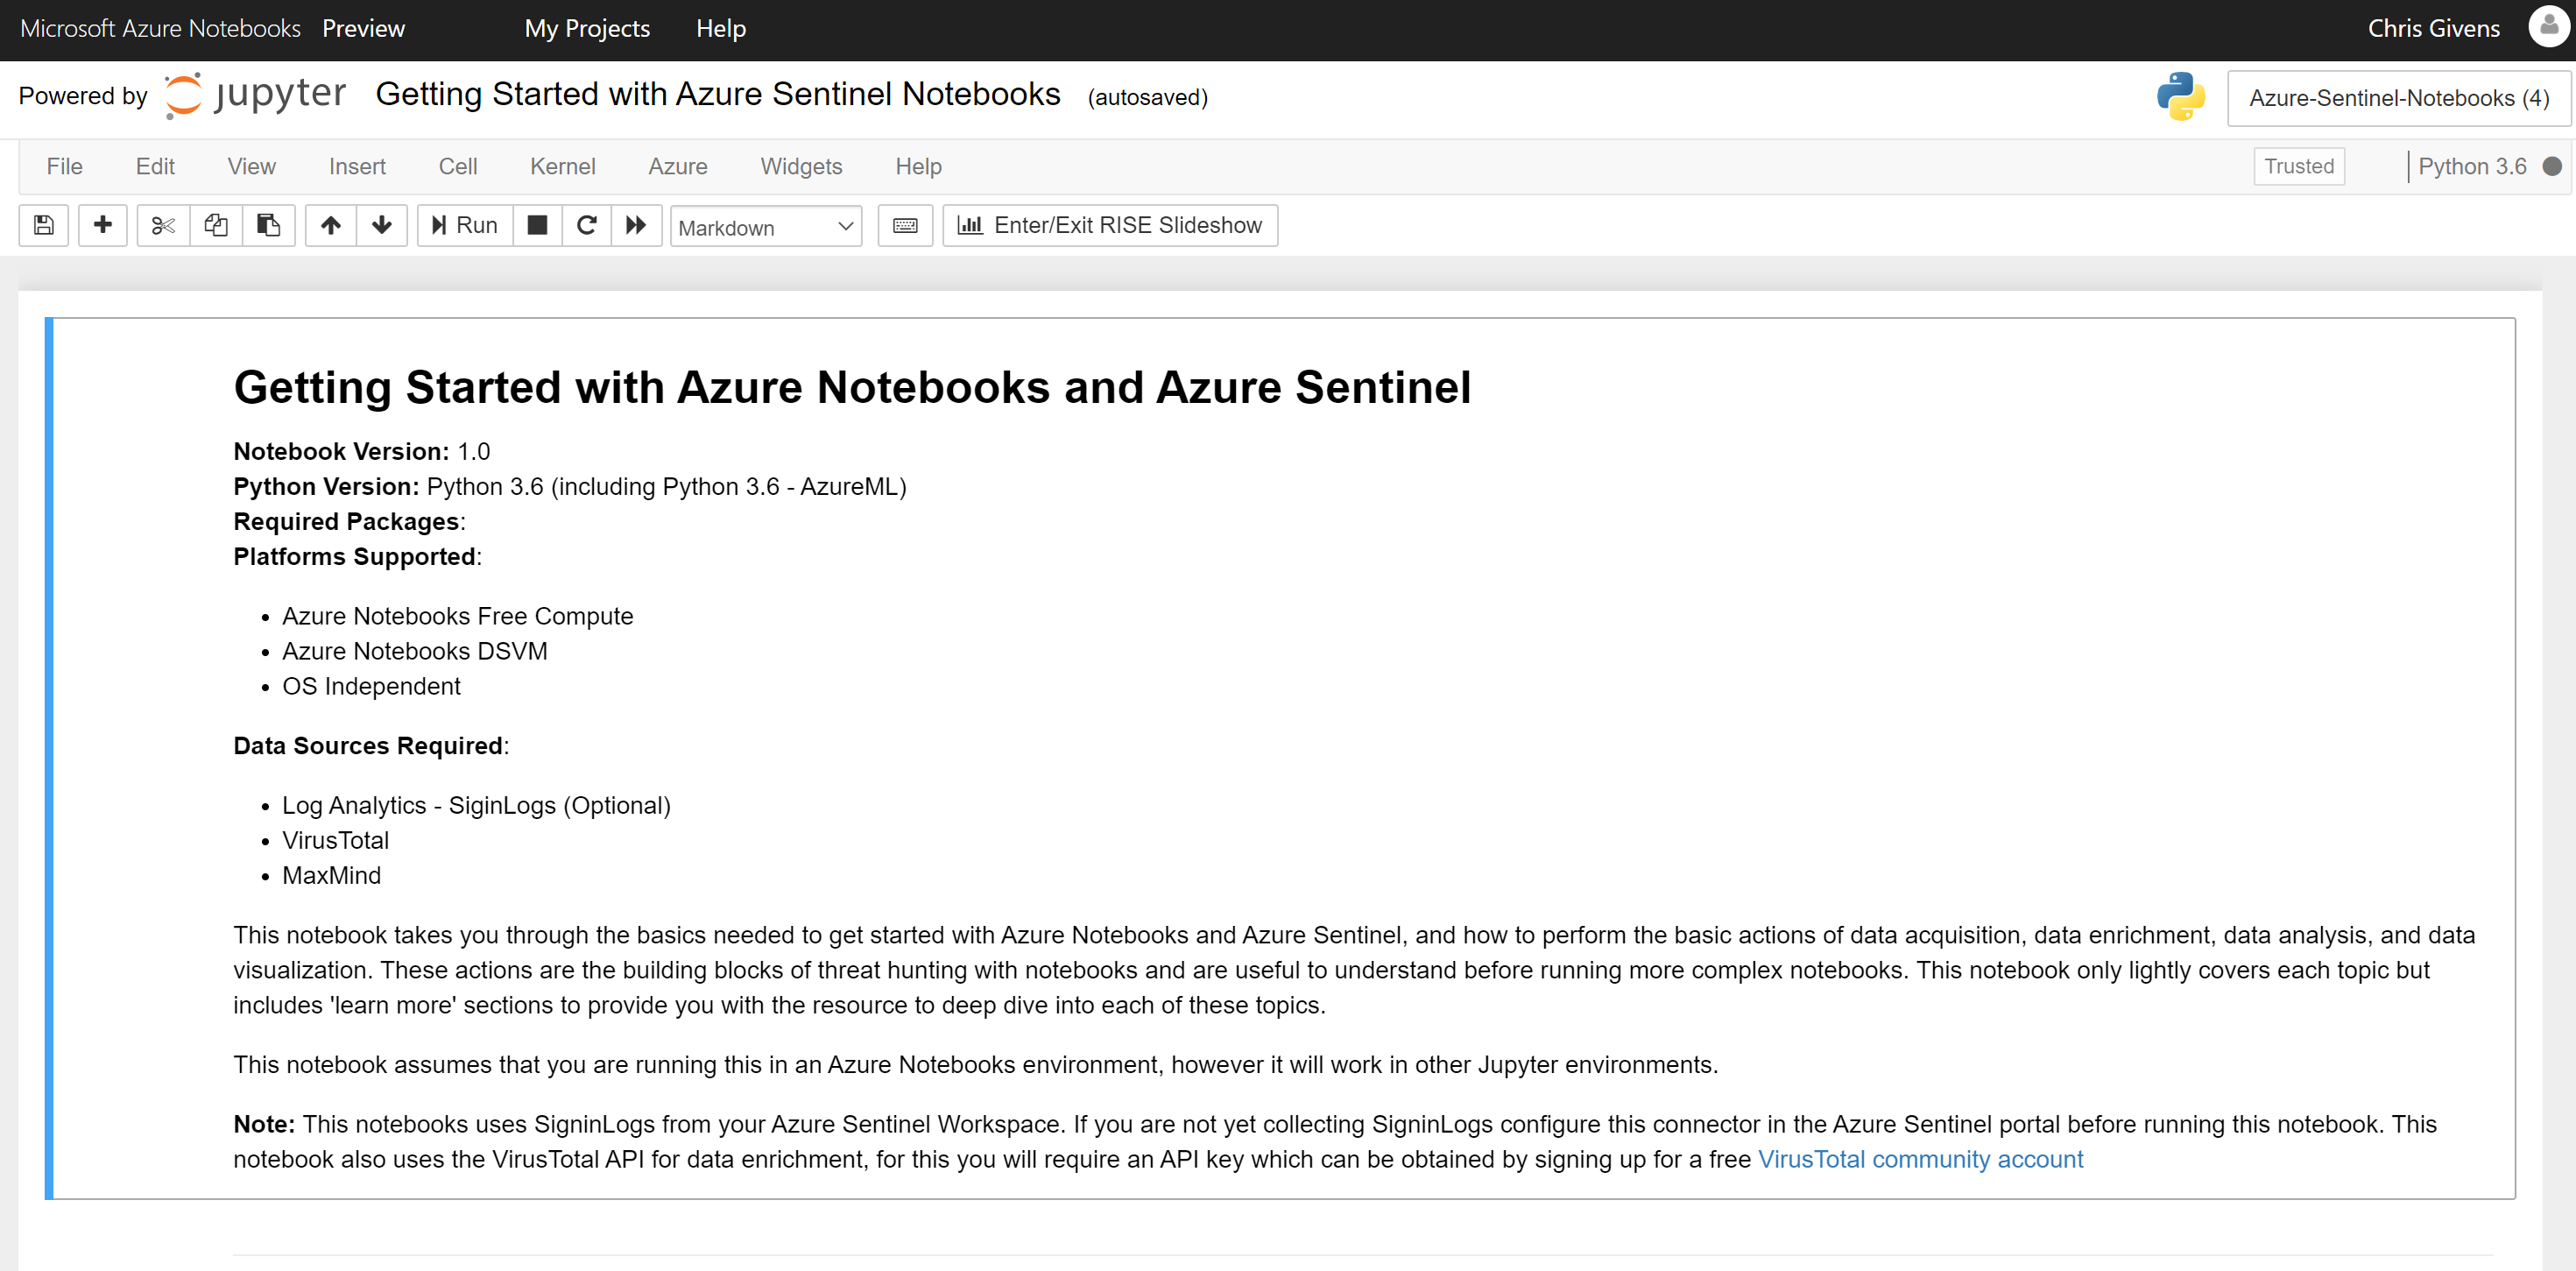 The getting started Sentinel notebook is displayed.
Task 6: Creating reports with Power BI
- Navigate back to your Azure Sentinel browser window. Select Logs.Note: You may see a Welcome to Log Analytics splash page in the blade. Select Get Started.
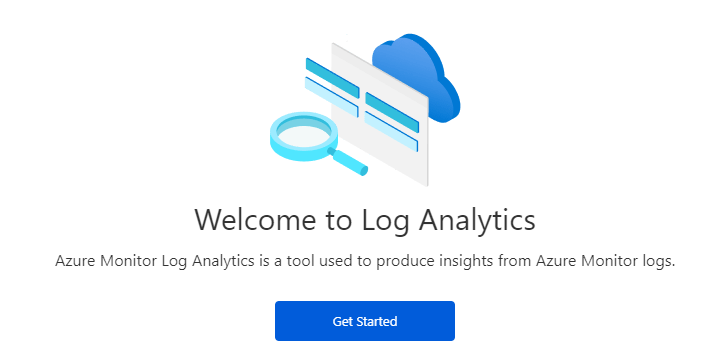 The screenshot displays the Welcome to Log Analytics blade.
 - In the Schema tab under Active, expand the LogManagement node, notice the various options available.
- In the schema window, select AzureDiagnostics, then choose the eye icon.
- In the top right, select Export, then select the Export to Power BI (M Query) link.
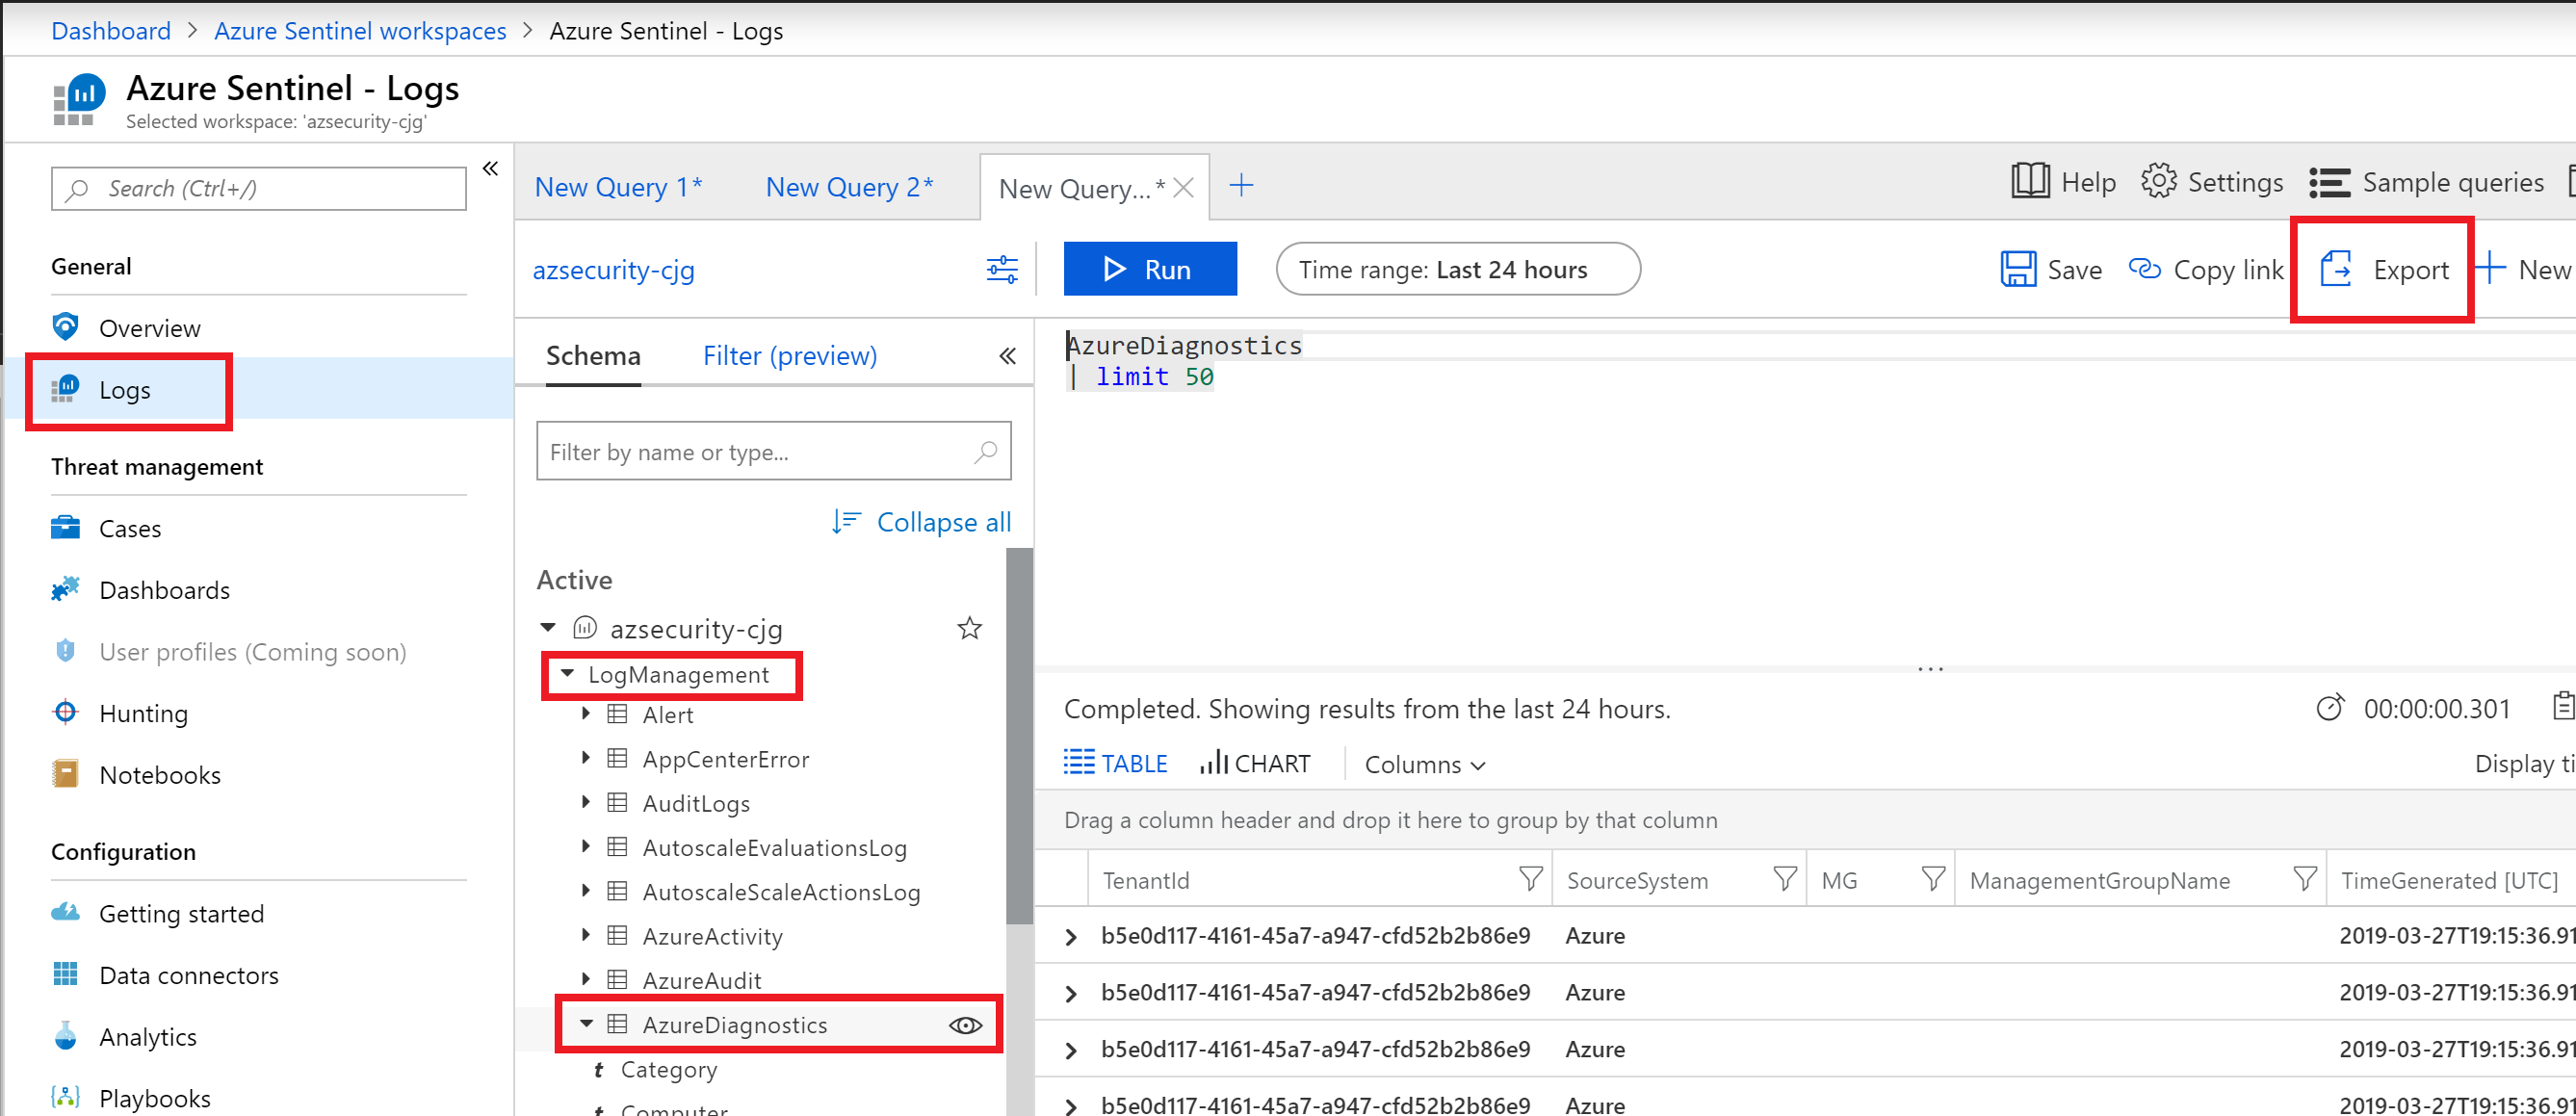 The Azure Sentinel Logs screen is displayed. The logs item is selected in the left menu. LogManagement and AzureDiagnostics are selected from the active schema list. The Azure Diagnostics item has an eye icon. A new query tab is shown with the Export item highlighted.
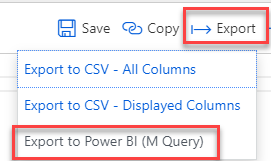 The Export item is expanded with the Export to PowerBI (M Query) item highlighted.
 - Select Open, a text document with the Power Query M Language will be displayed.
- Follow the instructions in the document to execute the query in Power BI.
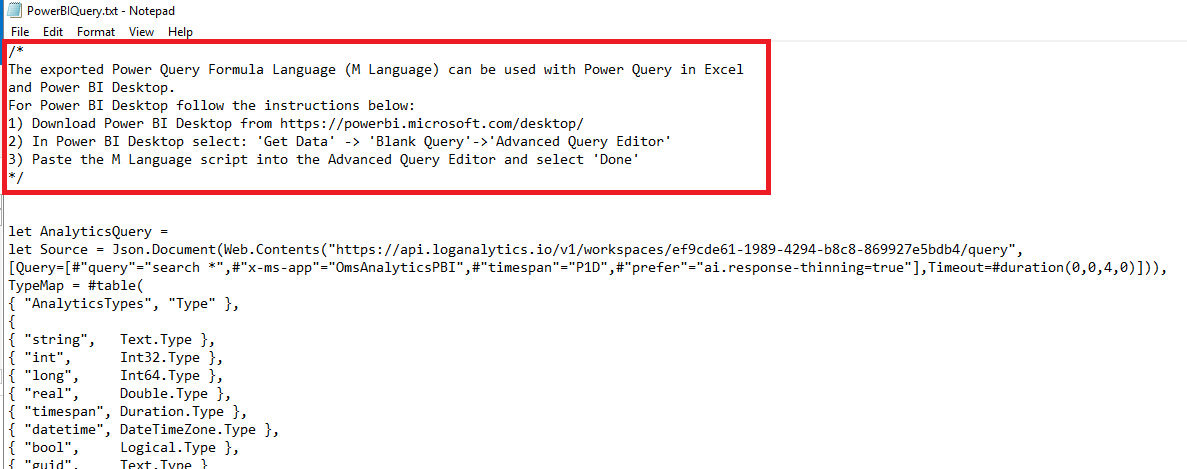 The instructions at the top of the PowerBIQuery.txt file are highlighted.
 - Close Power BI.
Exercise 7: Using Compliance Tools (Azure Policy, Secure Score and Compliance Manager)
Duration: 15 minutes
In this exercise, attendees will learn to navigate the Azure Policy and Secure Score features of Azure. You will also explore the Compliance Manager portal that will provide you helpful tasks that you should consider when attempting to achieve specific compliance policies.
Task 1: Review a basic Azure Policy
- Open the Azure Portal. Select All Services, then type policy. Select Policy in the list of items.
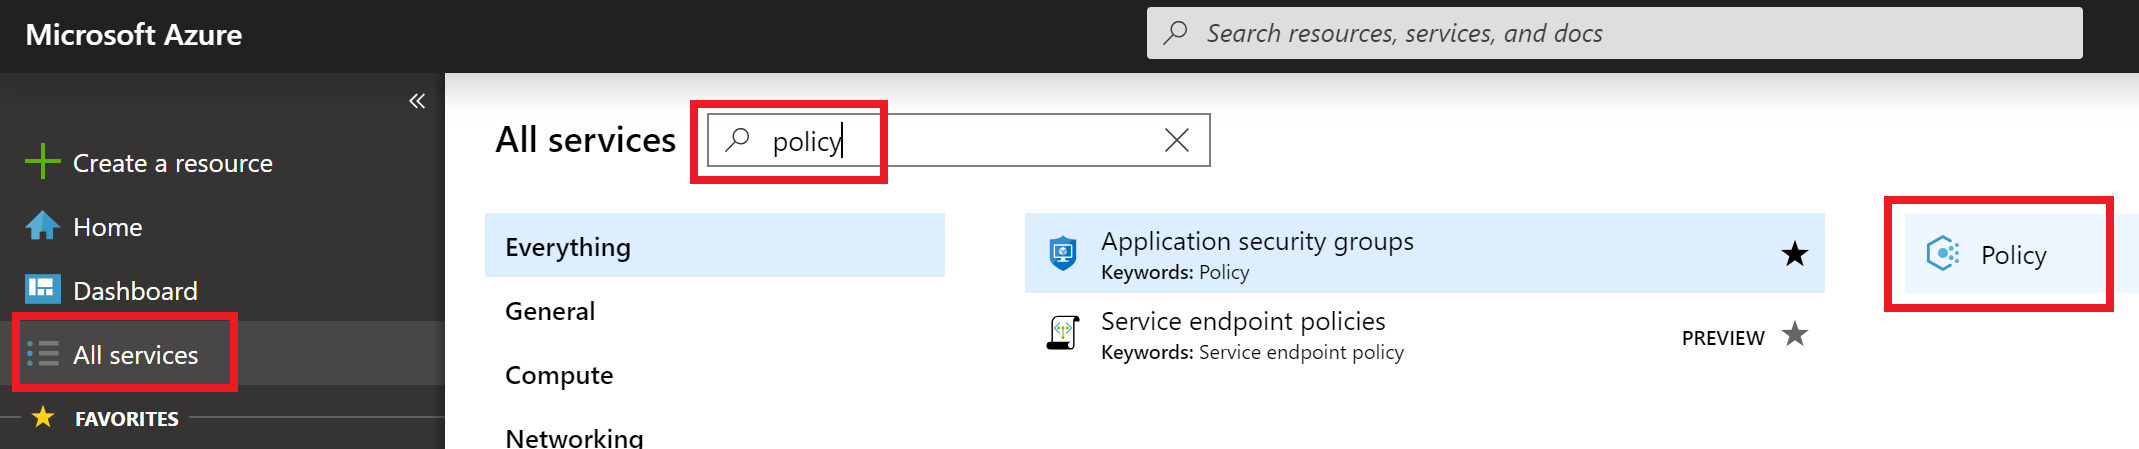 All services are selected in the left menu. In the search box policy is entered. Policy is selected from the filtered list of services.
 - In the blade menu, select Compliance, and review your Overall resource compliance percentage.
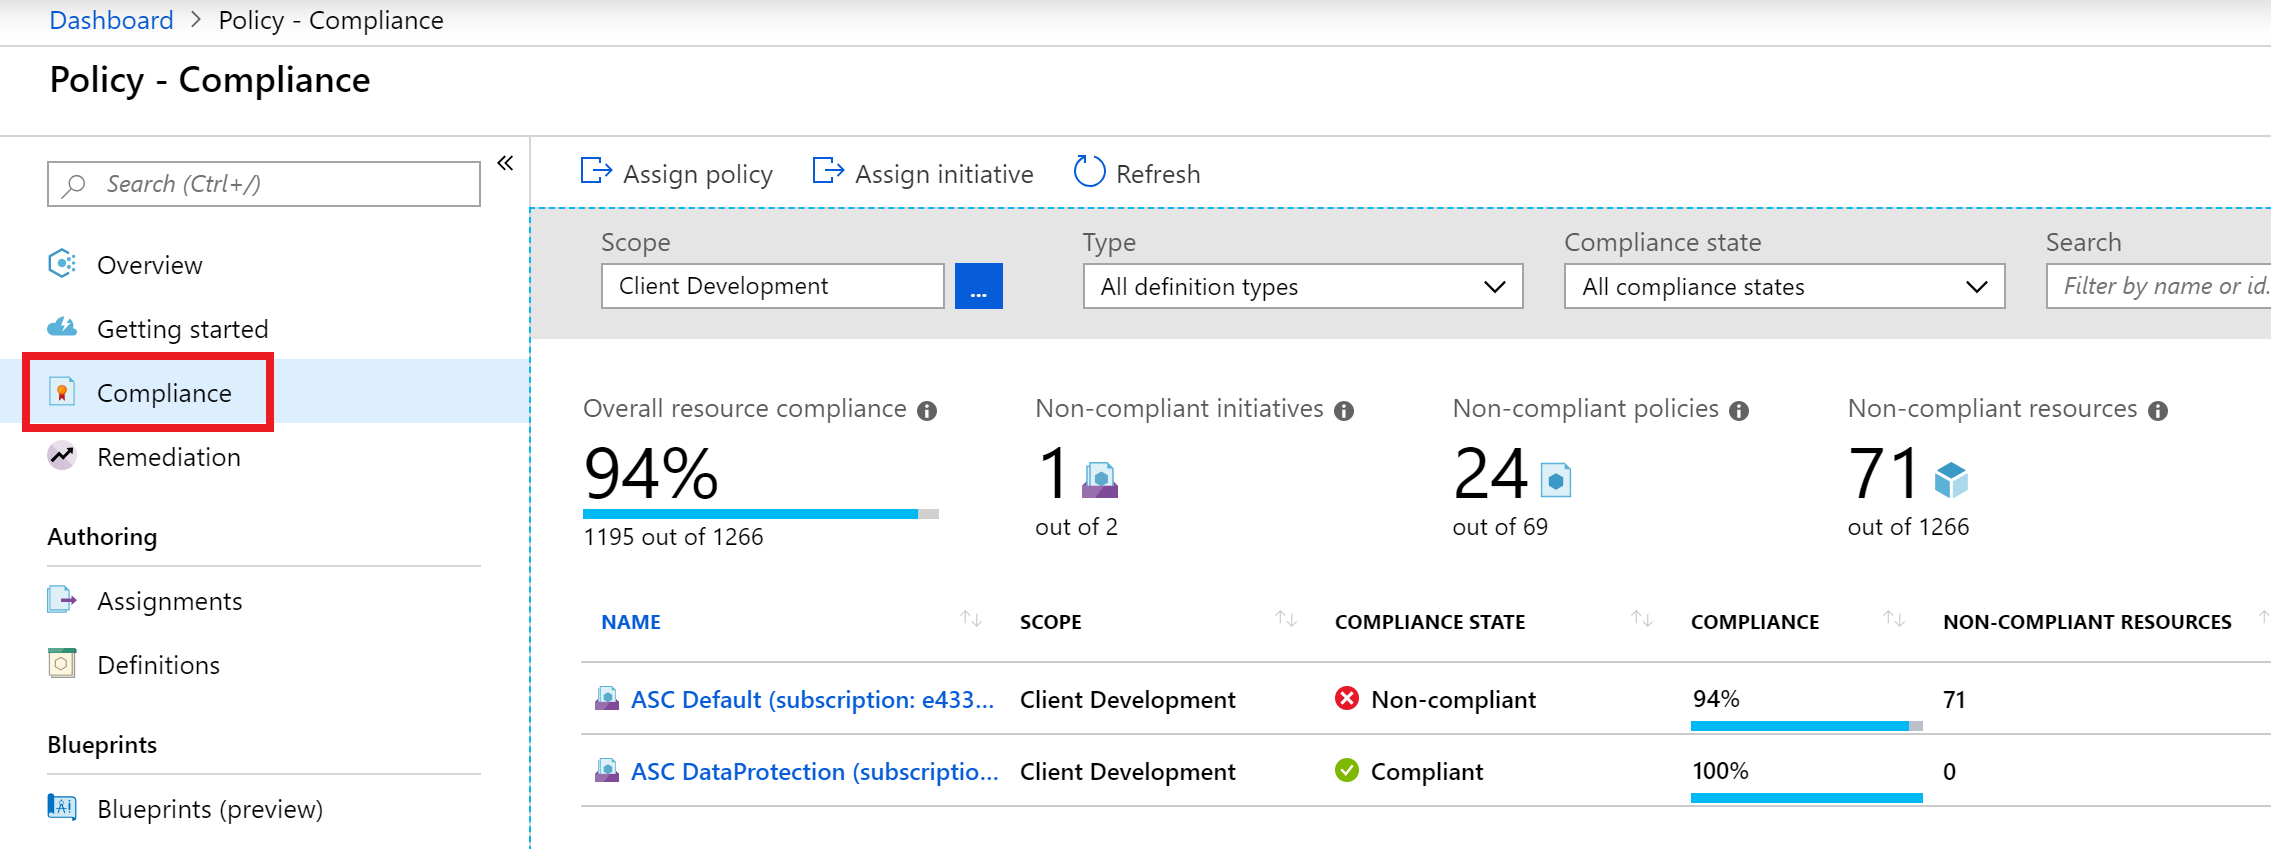 The Compliance item is selected from the left menu. The Policy compliance screen is displayed.
 - For the scope, ensure the proper subscription is selected, then select ASC Default (subscription:.
- In the Initiative compliance blade, review your compliance metrics.
- Scroll to the results area and select the Non-compliant resources tab.
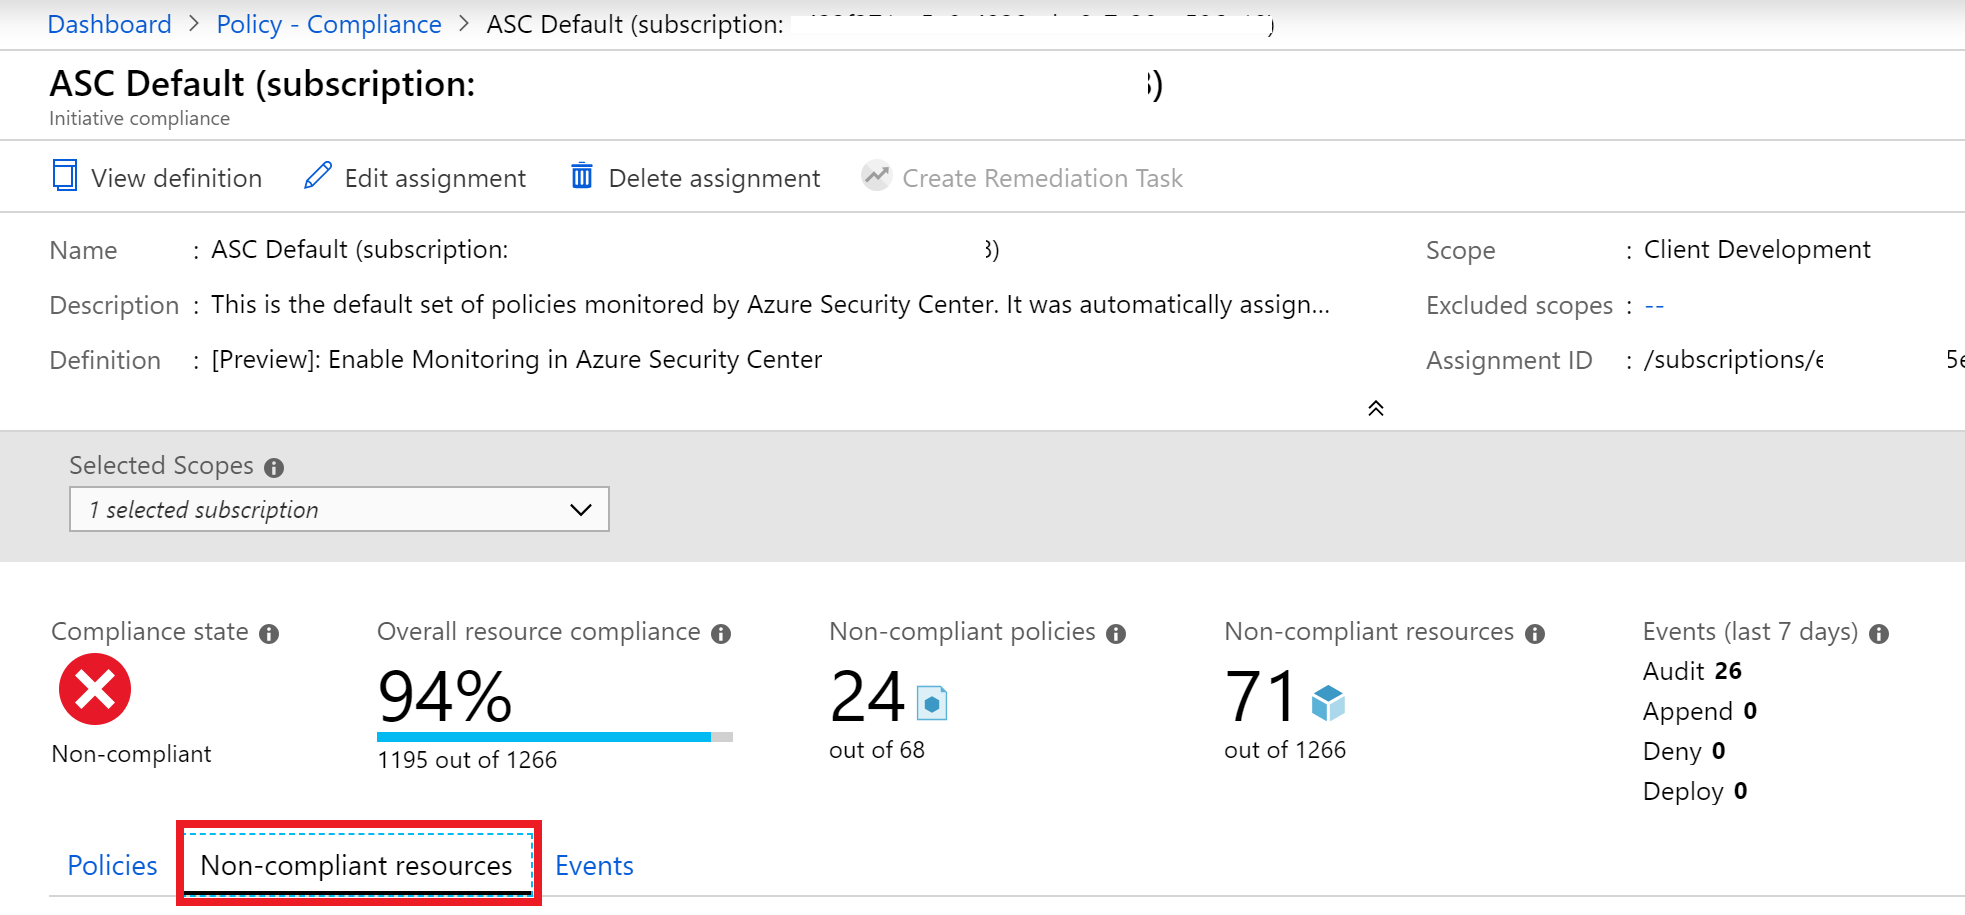 The non-compliant resources tab is highlighted.
 - In the filter search box, type paw-1 and select it when displayed.Note: You may not see resources display right away. If this is the case, then scroll through some other non-compliant resources.
- With the Policies tab selected, review the policies that the resource is non-complying against.Note: New policies are being created and your number may be different from the image below.
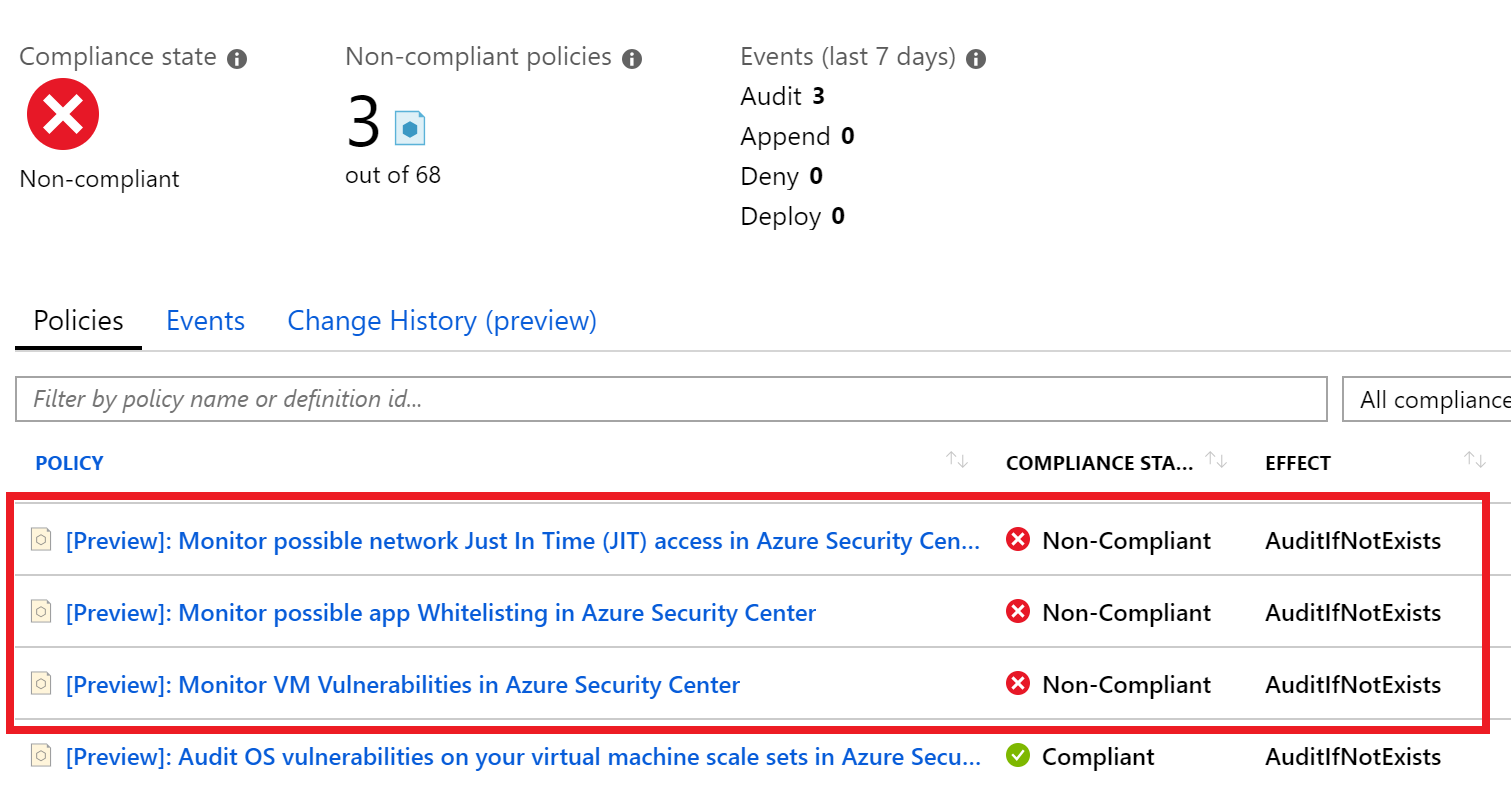 The Resource compliance blade for paw-1 is displayed with the non-compliant items highlighted.
 - Choose one of the policies. Review the Definition JSON of the policy definition, notice how it is based on ARM Template format and is looking for specific properties to be set of the non-compliant resources.
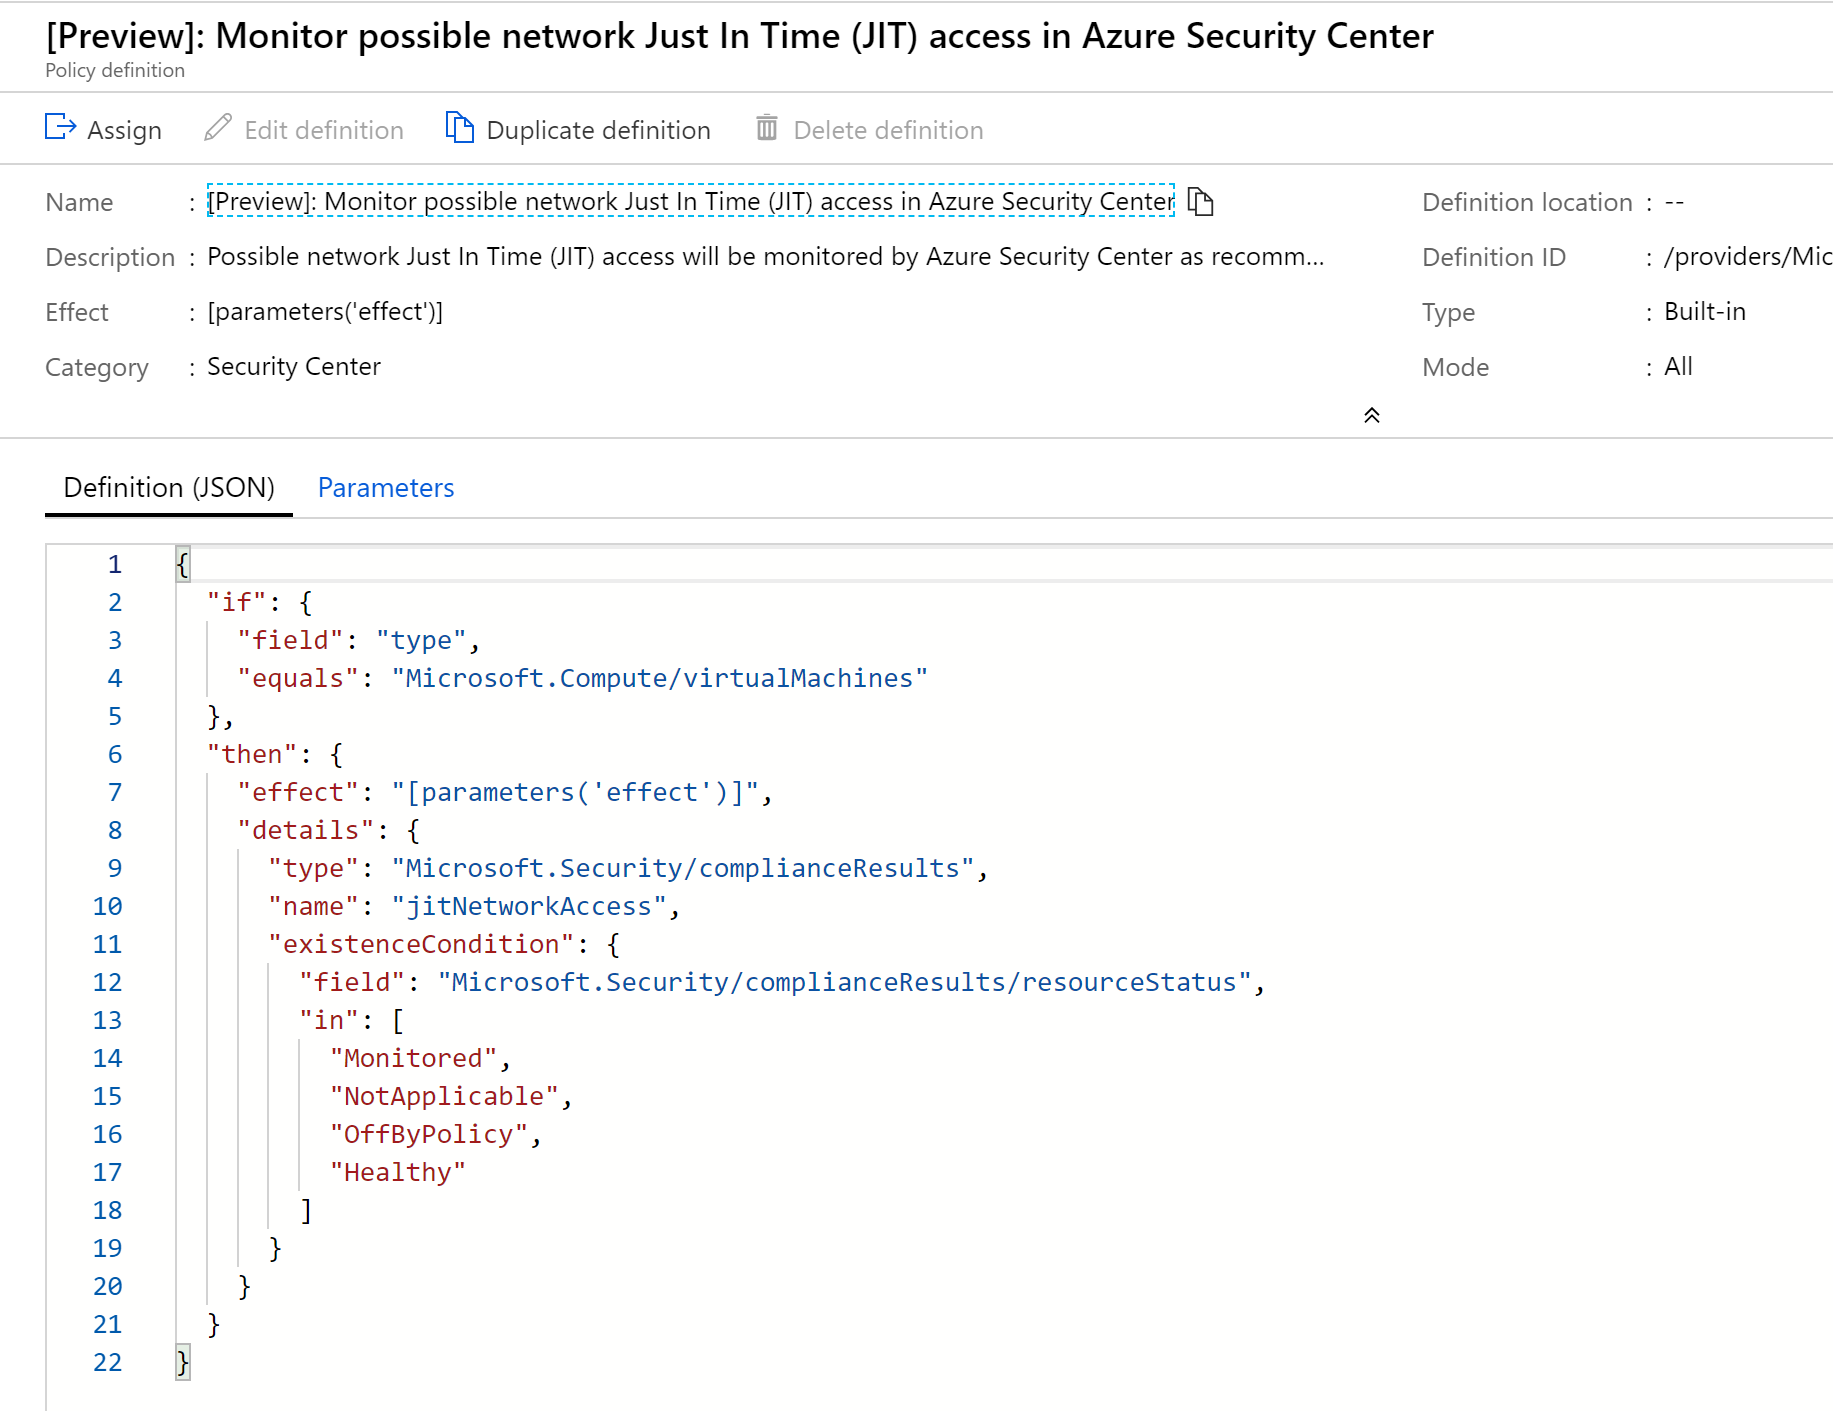 The policy definition is displayed in JSON format.Note: You can use these out of box templates to build your own policies and apply them as blueprints.
Task 2: Review and create Azure Blueprints
- In the Policy blade, under Authoring, select Definitions. These are a list of all defined policies which can be selected for assignment to your subscription resources.
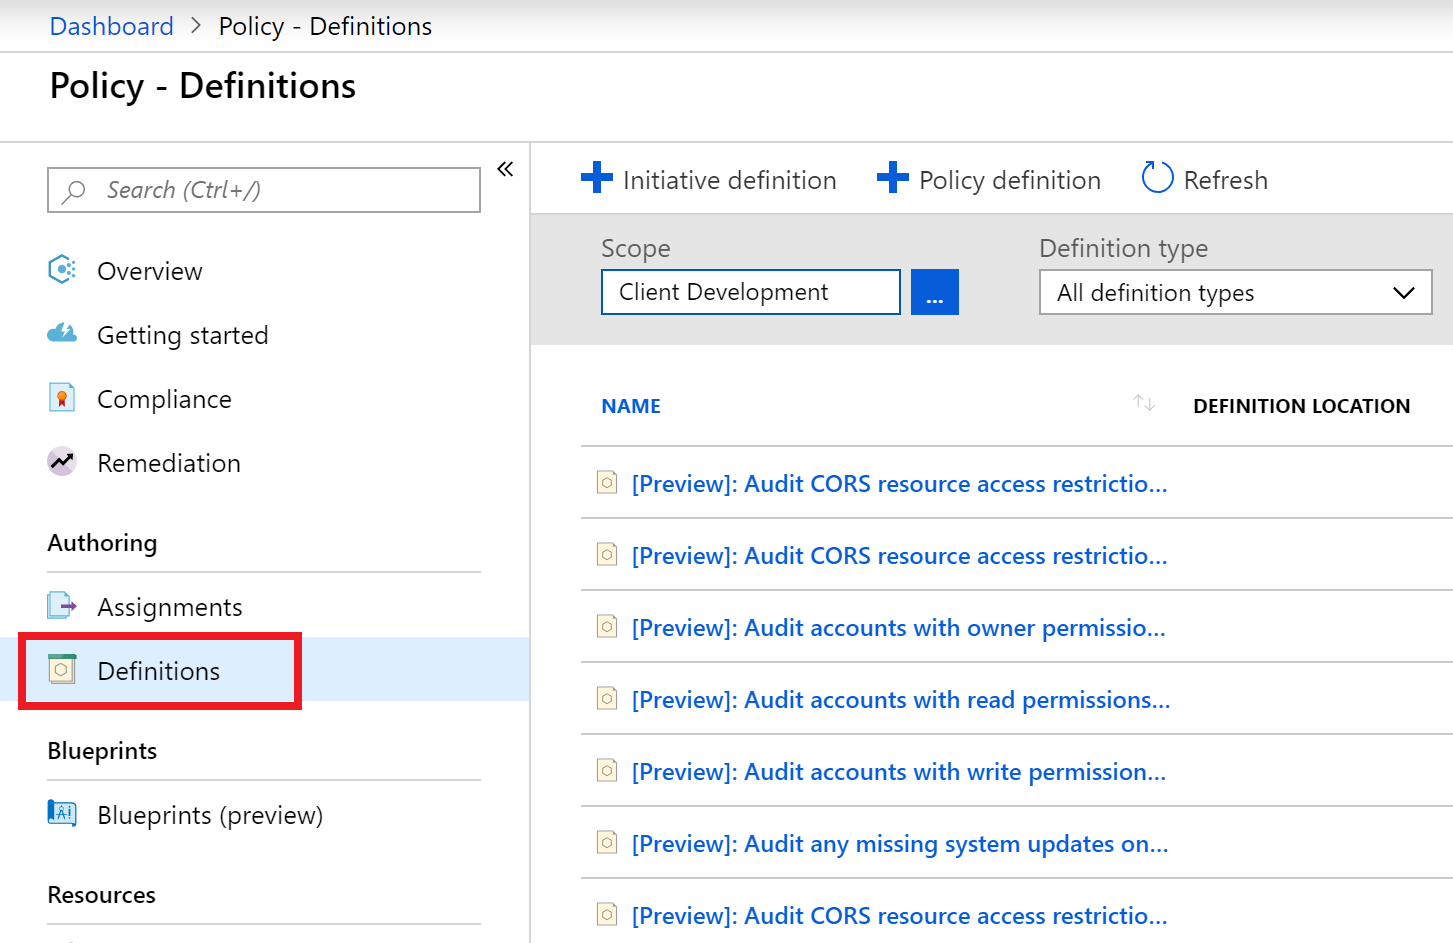 A listing of policy definitions on the Policy Blade Definitions screen.
 - In the Policy blade, under Related Services, select Blueprints.
- In the Blueprints blade, select Blueprint definitions.
- Select +Create blueprint.
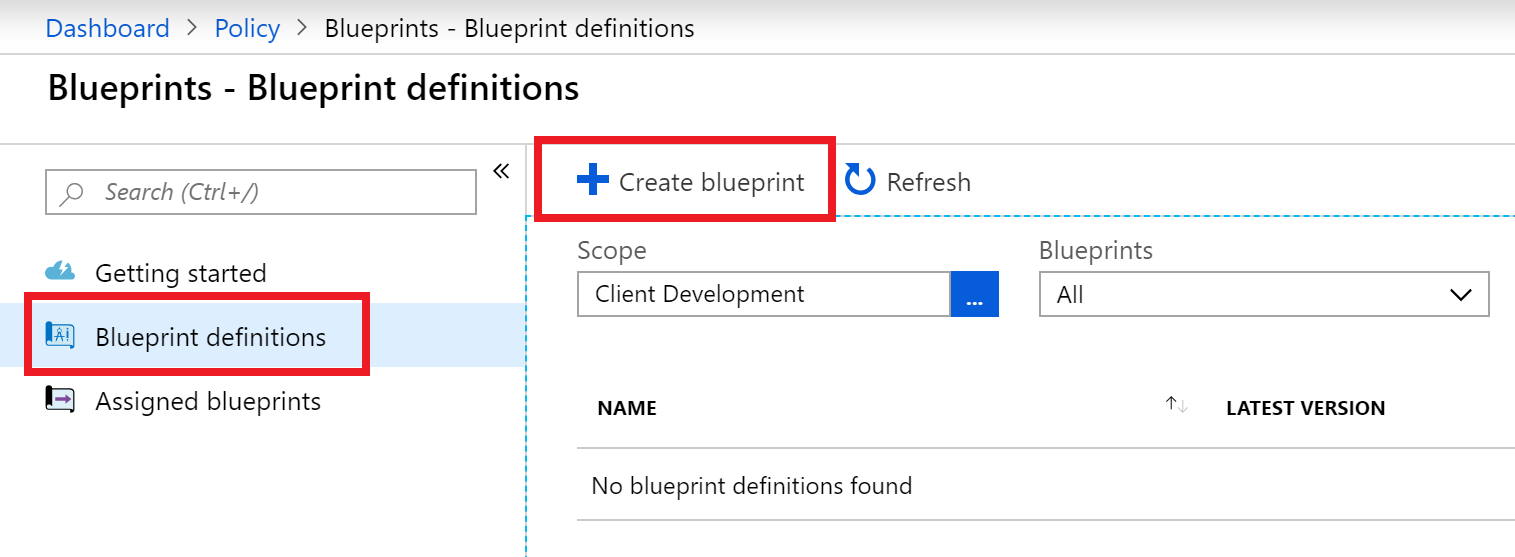 The Blueprint definitions screen is displayed with the Blueprint definitions item selected from the left menu. The + Create blueprint menu item is selected.
 - Review some of the sample blueprints, then select Start with blank blueprint.
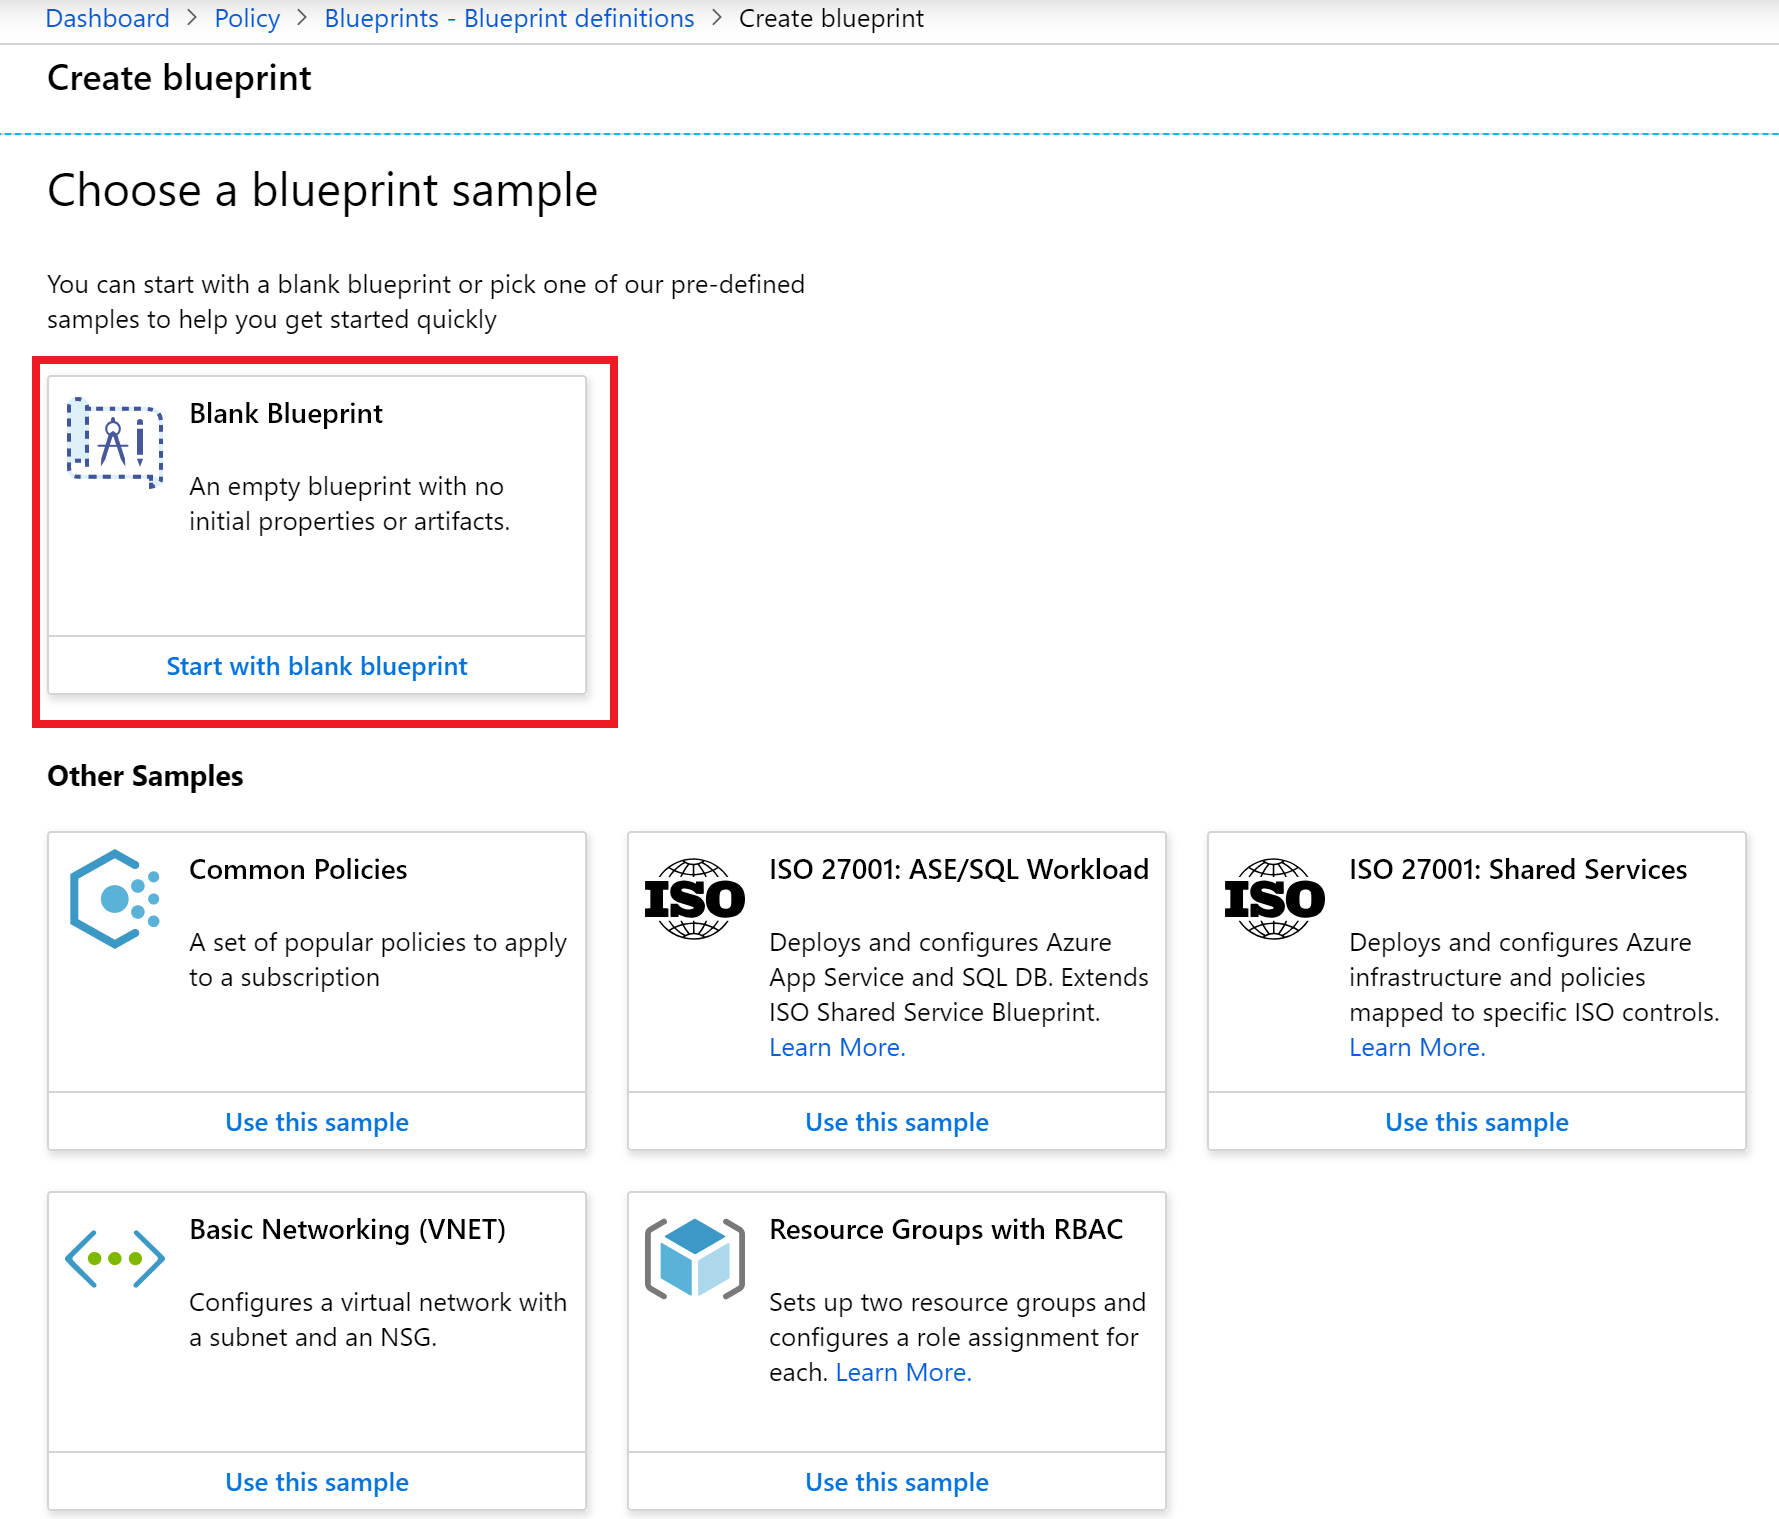 The Create blueprint screen is displayed with the Blank blueprint item selected from the list of available samples.
 - For the name, type gdprblueprint.
- For the location, select the ellipses, then select your subscription in the drop down.
- Choose Select.
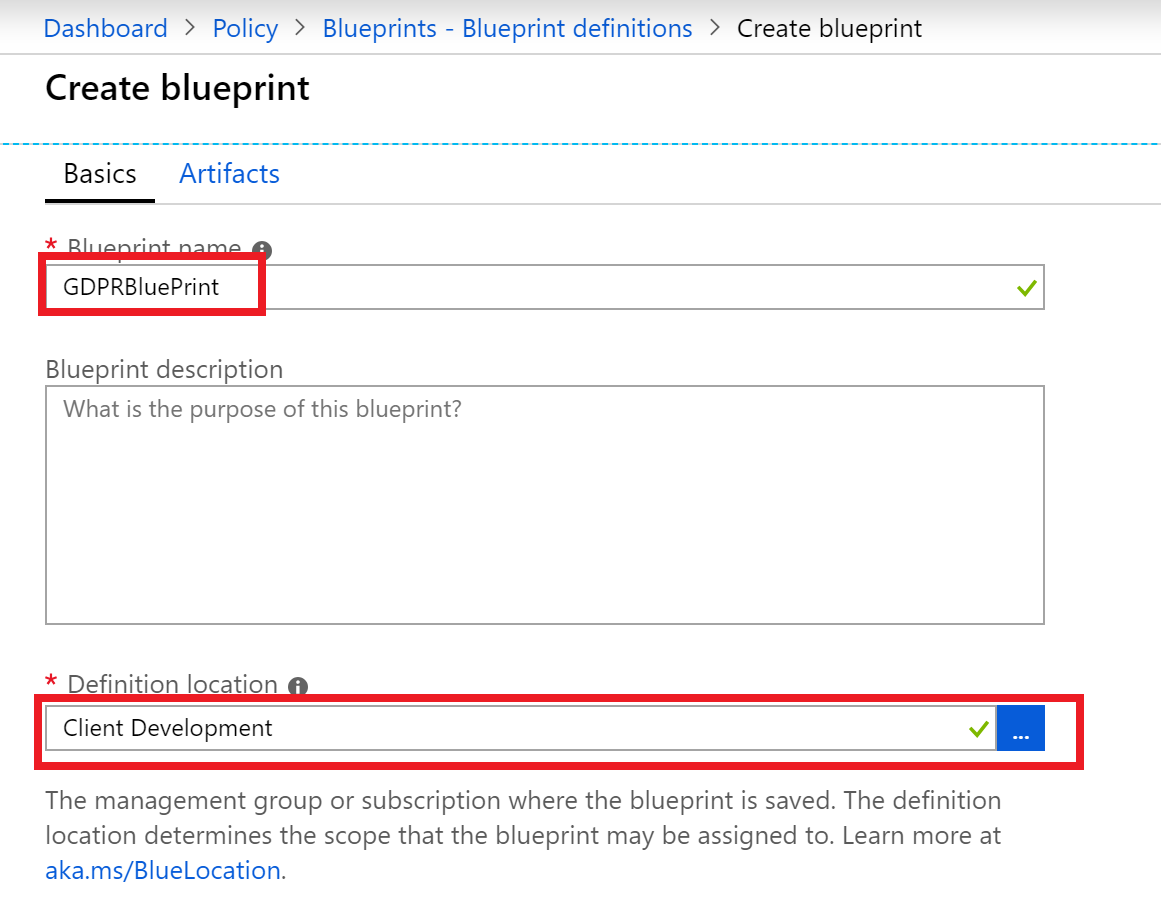 New blue print dialog with name and location filled in.
 - Select Next: Artifacts.
- Select + Add artifact.
- For the Artifact Type, select Policy assignment, review all the policies available to you (at the time of this writing you would see 37 definitions and 311 policies).
- In the search box, type unrestricted, browse for the Storage accounts should restrict network access.
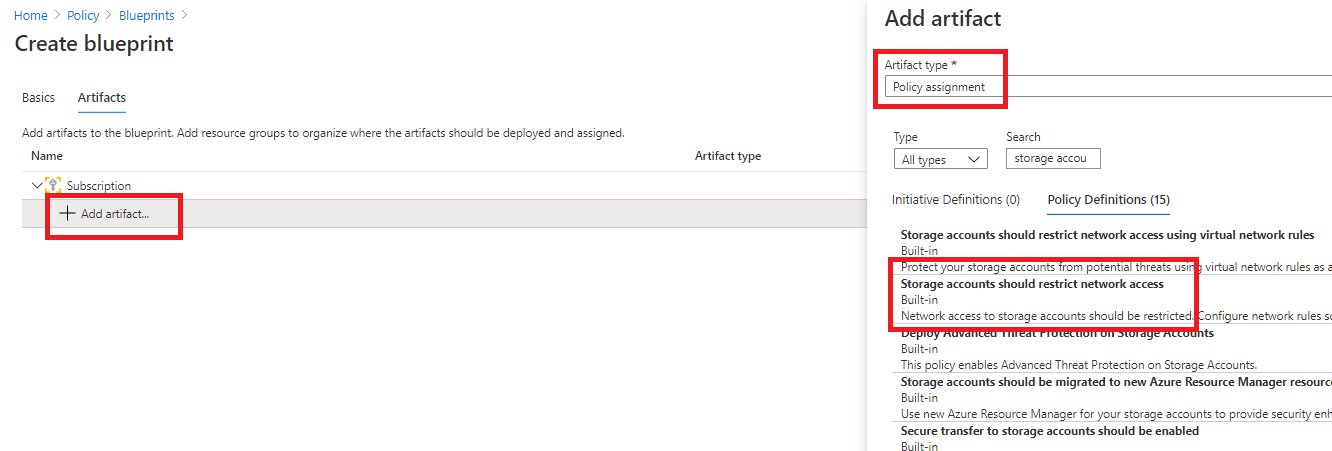 On the Create blueprint screen, on the Artifacts tab the + Add artifact link is selected beneath the Subscription. In the Add artifact blade, the artifact type of Policy assignment is selected. In the Search textbox, unrestricted is entered. Beneath the Search textbox, the Policy Definitions tab is selected and the Audit unrestricted network access to storage accounts is selected from the list of search results.Note: If the above definition is not available, select one of your own choosing.
 - Select Add.
- Select Save Draft. It may take a few minutes. The blade will automatically change when the save operation finishes.
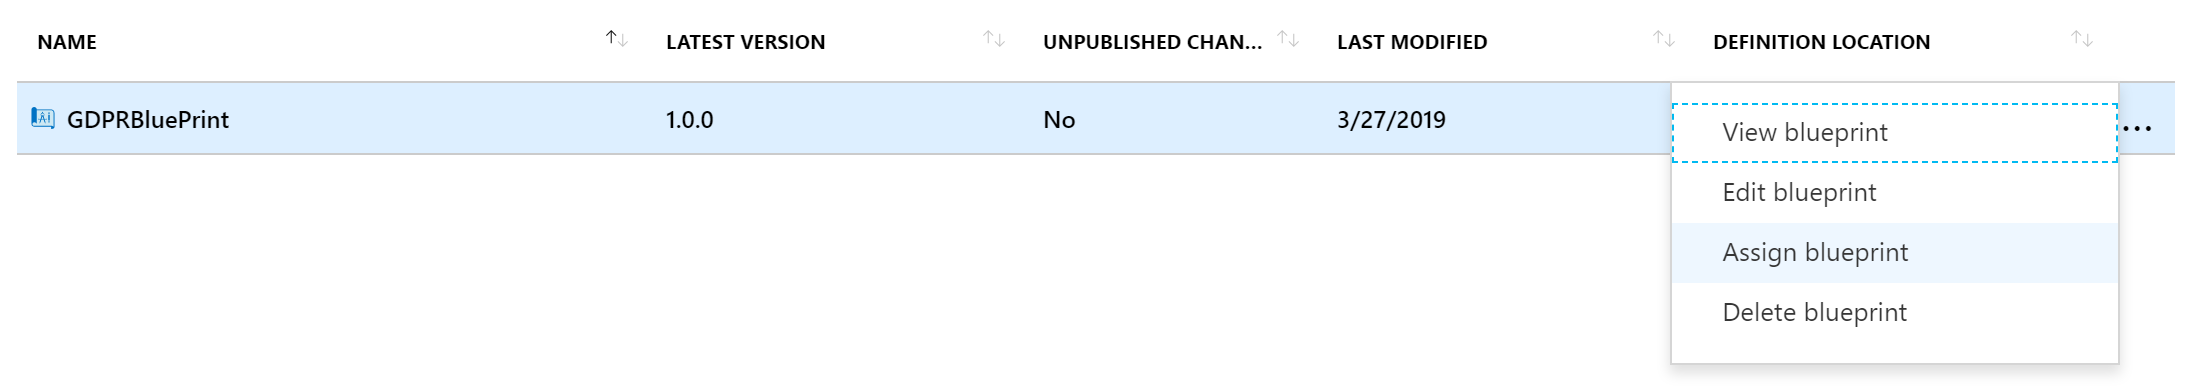
- For the new blueprint, select the ellipses, then select Publish blueprint.
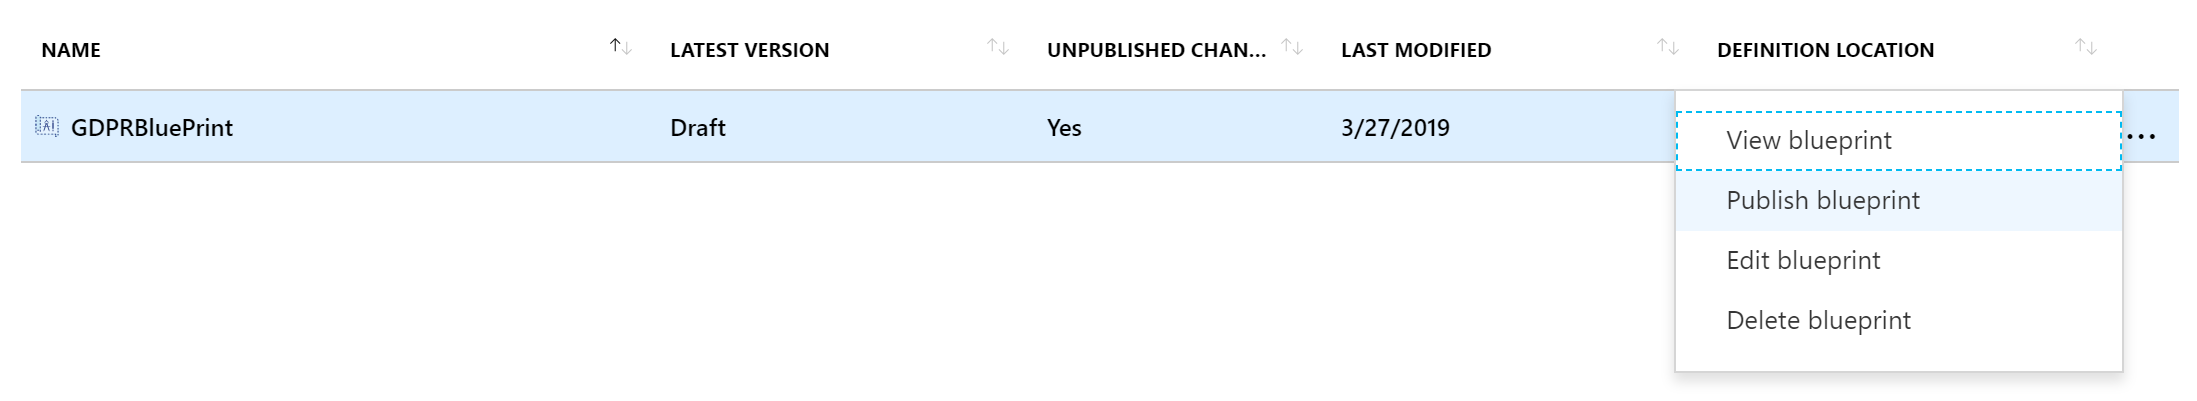 The ellipses menu is expanded for the gdprblueprint blueprint item with the Publish blueprint menu item highlighted.
 - Select Publish.
- For the version type 1.0.0.
- For the new blueprint, select the ellipses, then select Assign Blueprint.Screen shot showing the Assign blueprint dialog.
- Review the page, then choose Assign. This policy will now be audited across all your storage accounts in the specific subscription.
Task 3: Secure Score
- In the Azure Portal, select All Services, then type Security, select Security Center.
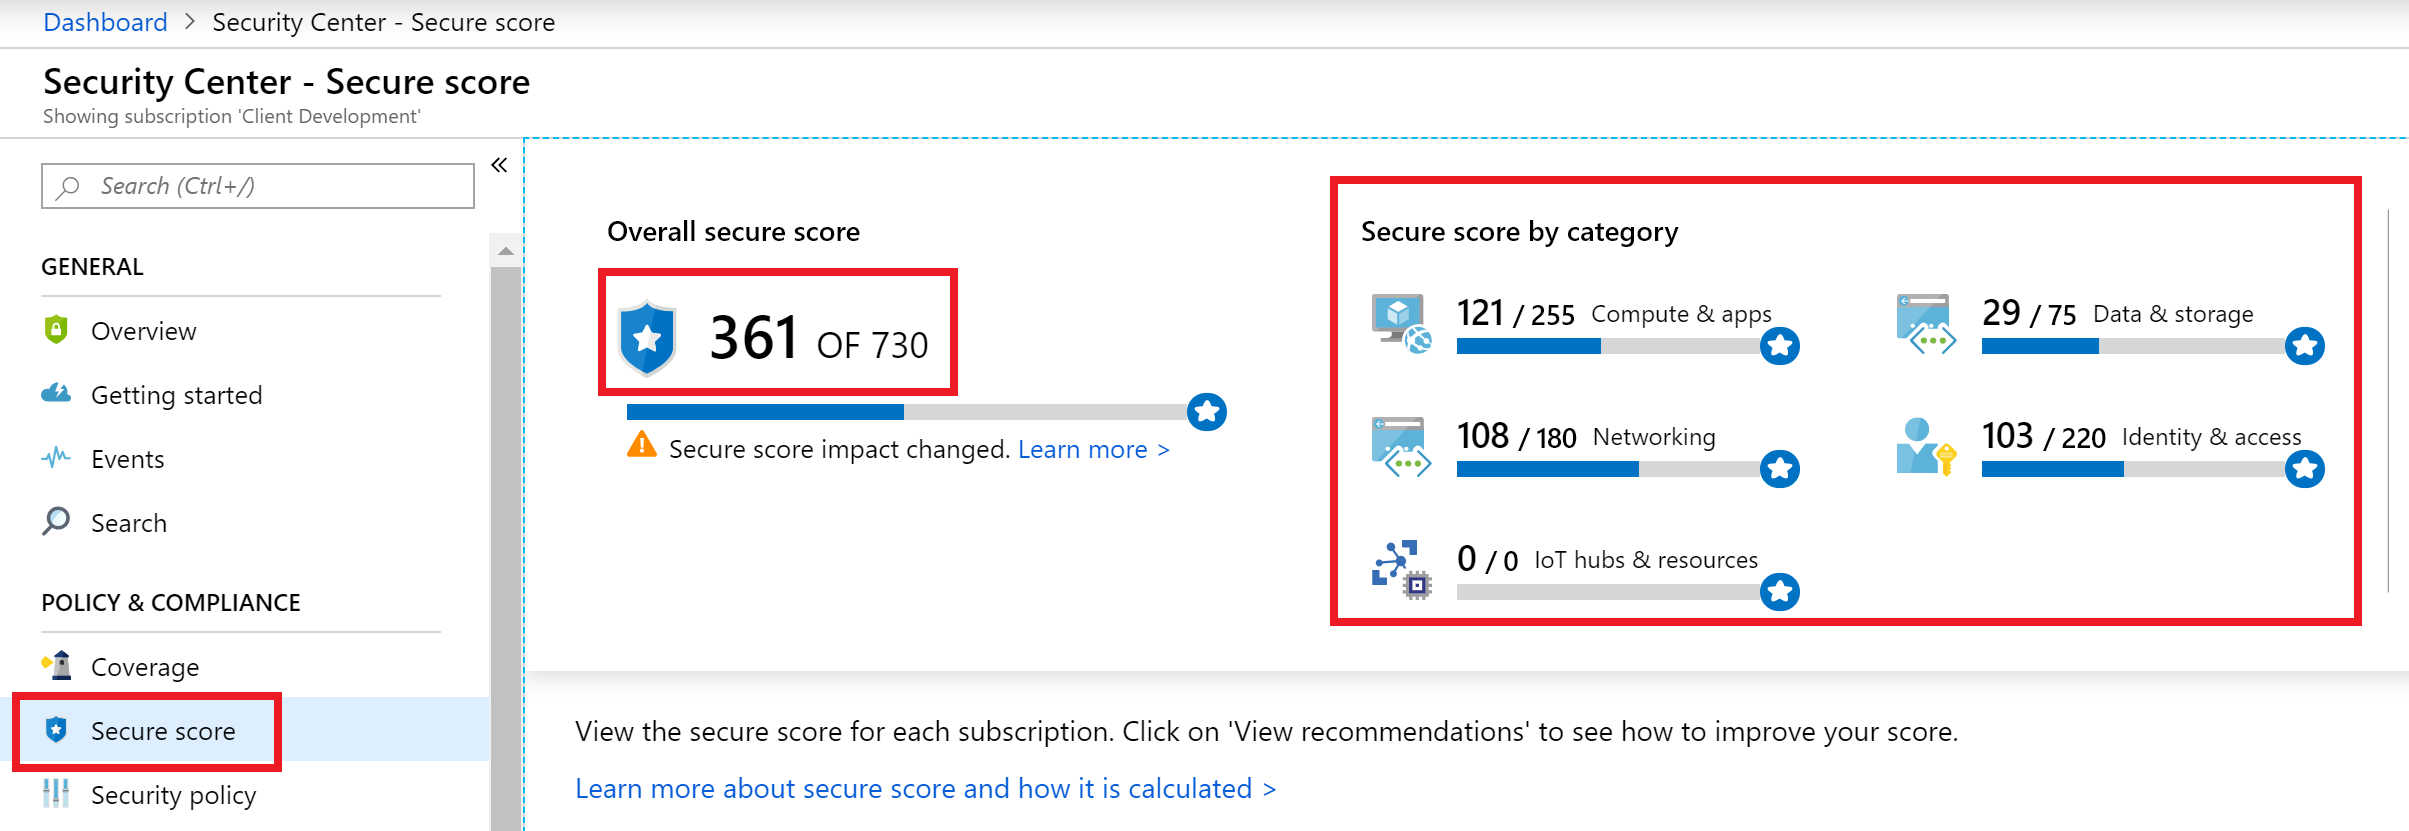
- In the Security Center blade, under POLICY & COMPLIANCE, select Secure score.
- Review your overall secure score values and then notice the category values.
 Screen shot showing Secure score blade and the score and categories highlighted.
 - On the bottom half of the window, select your subscription, you will be presented with the items that have failed resource validation sorted by the score value that is assigned to that particular recommendation item.
- Select the An Azure Active Directory administrator should be provisioned for SQL Servers, on the recommendation blade, you will be presented with information about how to remediate the recommendation to gain the impact value to your score.
 Screen shot with the Provision an Azure AD Administrator for SQL Server highlighted.
Task 4: Use Compliance Manager for Azure
Note: You may need additional permissions to run this portion of the lab. Contact your Global Administrator.
- In a browser, go to the Service Trust/Compliance Manager portal (https://servicetrust.microsoft.com).
- In the top corner, select Sign in, you will be redirected to the Azure AD login page.
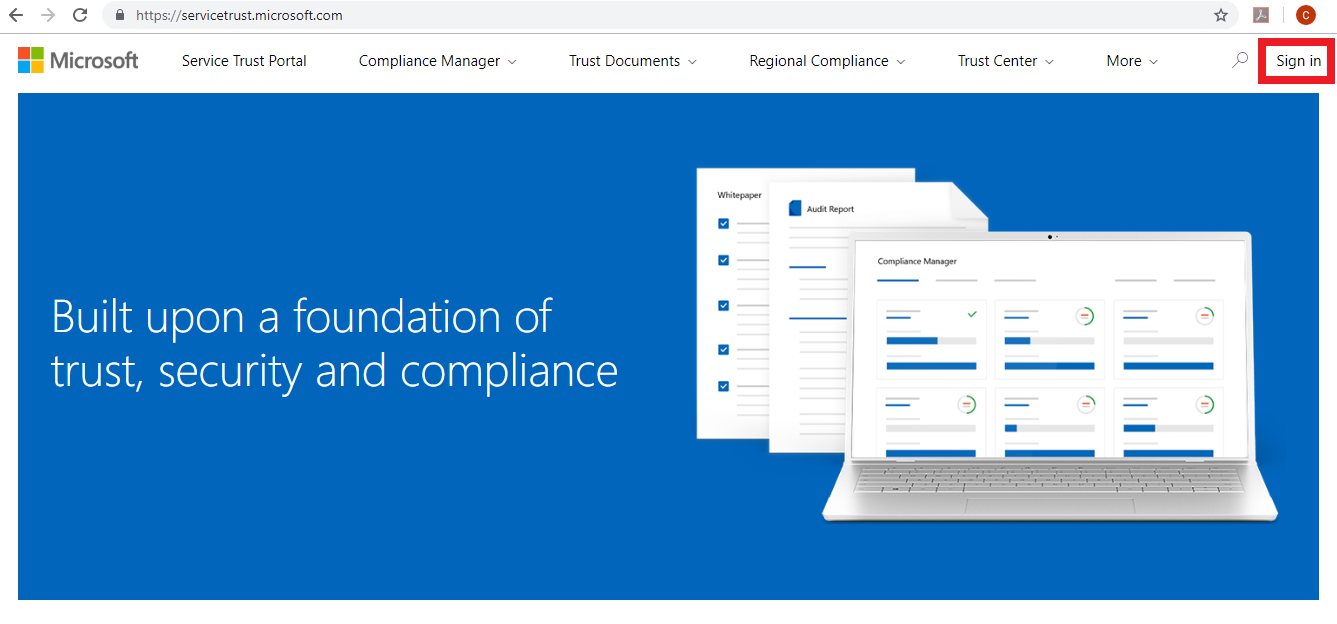 Sign in is highlighted at the top of the Service Trust/Compliance Manager portal.
 - If prompted, select or sign in with your Azure AD\Office 365 credentials.
- In the menu, select Compliance Manager->Compliance Manager Classic.
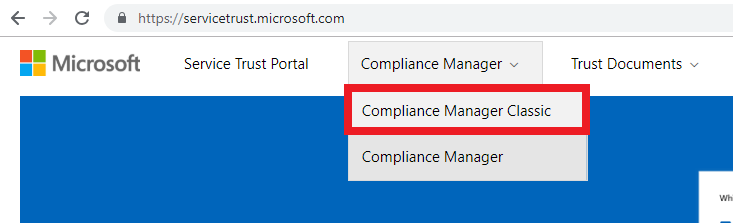 Compliance Manager Classic is highlight in the menu navigation.
 - Select on the +Add Assessment link.
- Select Create a new Group, for the name type AzureSecurity, select Next, set the Would you like to copy the data from an existing group toggle to No, select Next.
- For the product dropdown, select Azure.
- For the certification dropdown, select GDPR.
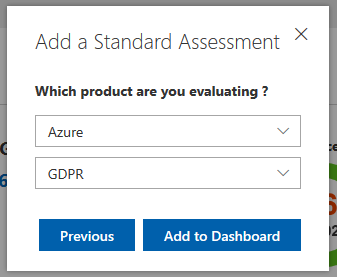 Add a Standard Assessment dialog with Azure and GDPR selected.
 - Select Add to Dashboard. You will now see a new assessment for Azure and GDPR in progress:
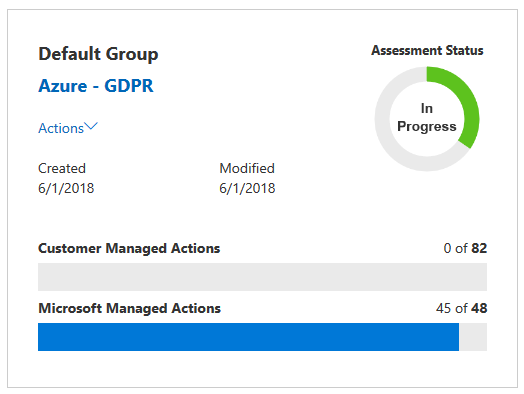 Azure GDPR assessment status that shows in progress.
 - Select Azure GDPR.
- Review the various controls that you can implement:
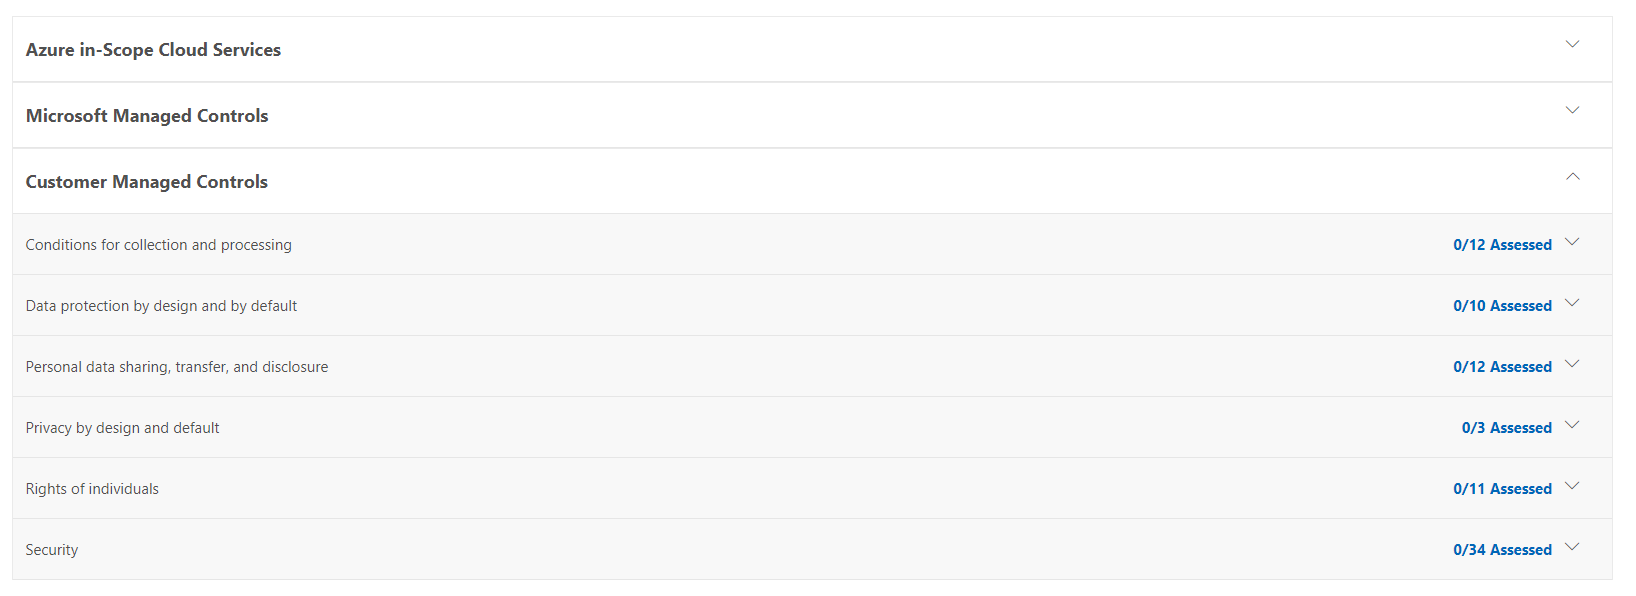 Several categories of controls are listed on the page.
 - On the top menu, choose Trust Documents, then select Audit Reports.
- Notice the various tabs that you can select from, select FedRAMP Reports.
- These are all the FedRAMP reports sorted by date that have been performed and publicly posted for Azure customer review. Select the item displayed and briefly review the document.
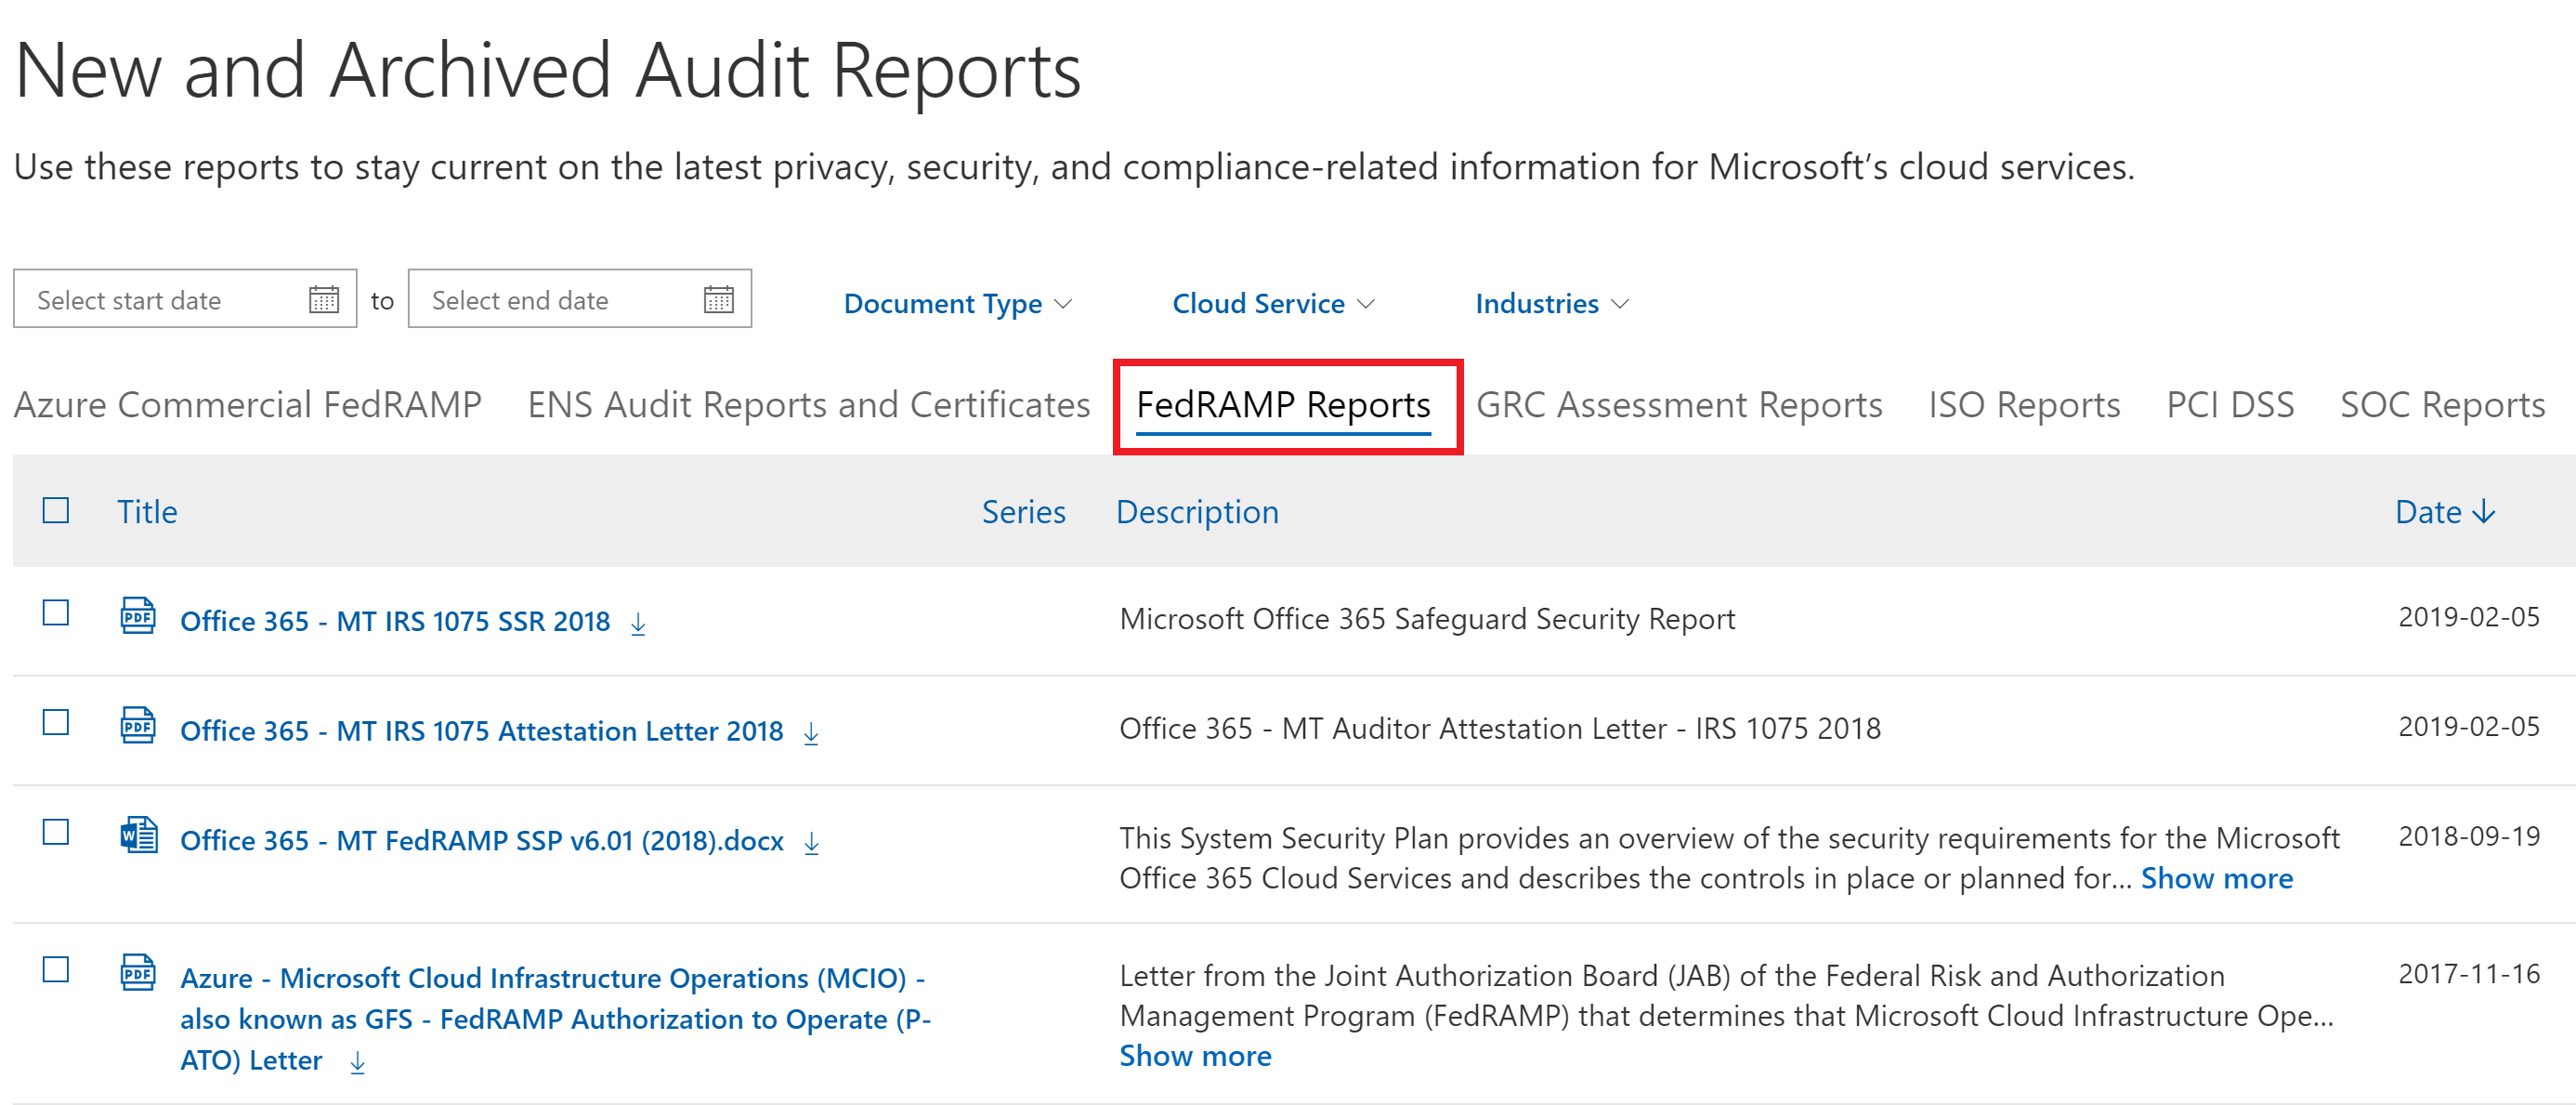 The FedRAMP Reports report type is highlighted on the Data Protection Standards and Regulatory Compliance Reports page, and Azure – FedRAMP Moderate System Security Plan v3.02 is highlighted at the bottom.
After the hands-on lab
Duration: 10 minutes
In this exercise, attendees will un-provision any Azure resources that were created in support of the lab.
Task 1: Delete resource group
- Using the Azure portal, navigate to the Resource group you used throughout this hands-on lab by selecting Resource groups in the menu.
- Search for the name of your research group, and select it from the list.
- Select Delete in the command bar, and confirm the deletion by re-typing the Resource group name and selecting Delete.
- Don’t forget to delete the Azure Key Vault application you created in Exercise 3, Task 3.
Task 2: Remove Standard Tier Pricing
- Be sure to set your Azure Security pricing back to Free.
Task 3: Delete lab environment (optional)
- If you are using a hosted platform, make sure you shut it down or delete it.
You should follow all steps provided after attending the Hands-on lab.